|

US Dollar Index technical analysis: Powell brings DXY up and Trump spoils the bull party

  • US President Trump announces additional tariffs on China sending USD down.
  • The correction down can reach 98.38, 98.10 and potentially 97.80.
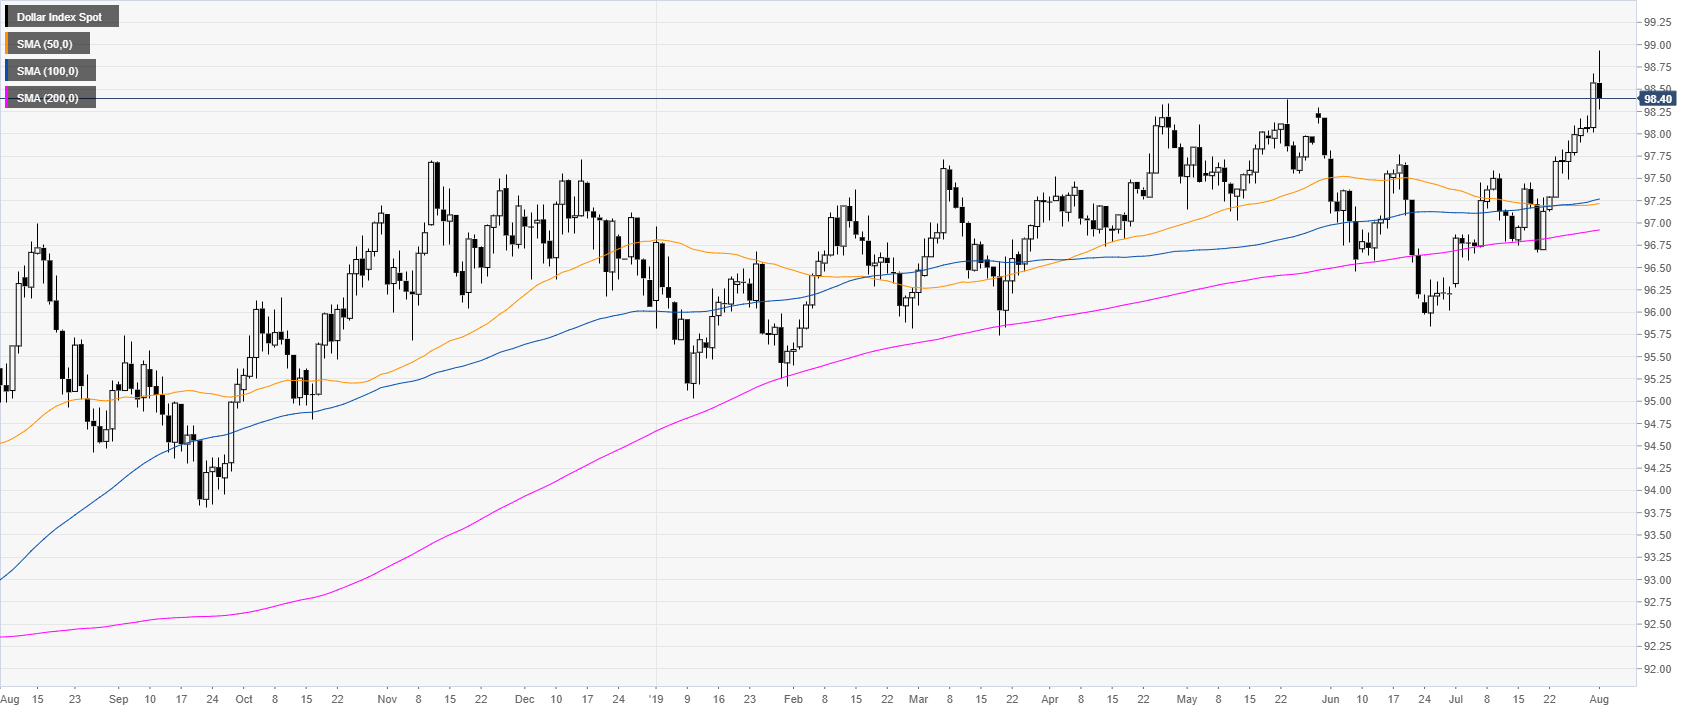


DXY daily chart

 
DXY (US Dollar Index) is trading in a bull trend above its main daily simple moving averages (DSMAs). On Wednesday DXY rose as the Federal Reserve made a hawkish cut of 25bps. This Thursday US President Trump announced new tariffs on China, sending USD down across the board. Interestingly, Fed’s Chair Powell said the trade war was the reason for the interest rate cut.
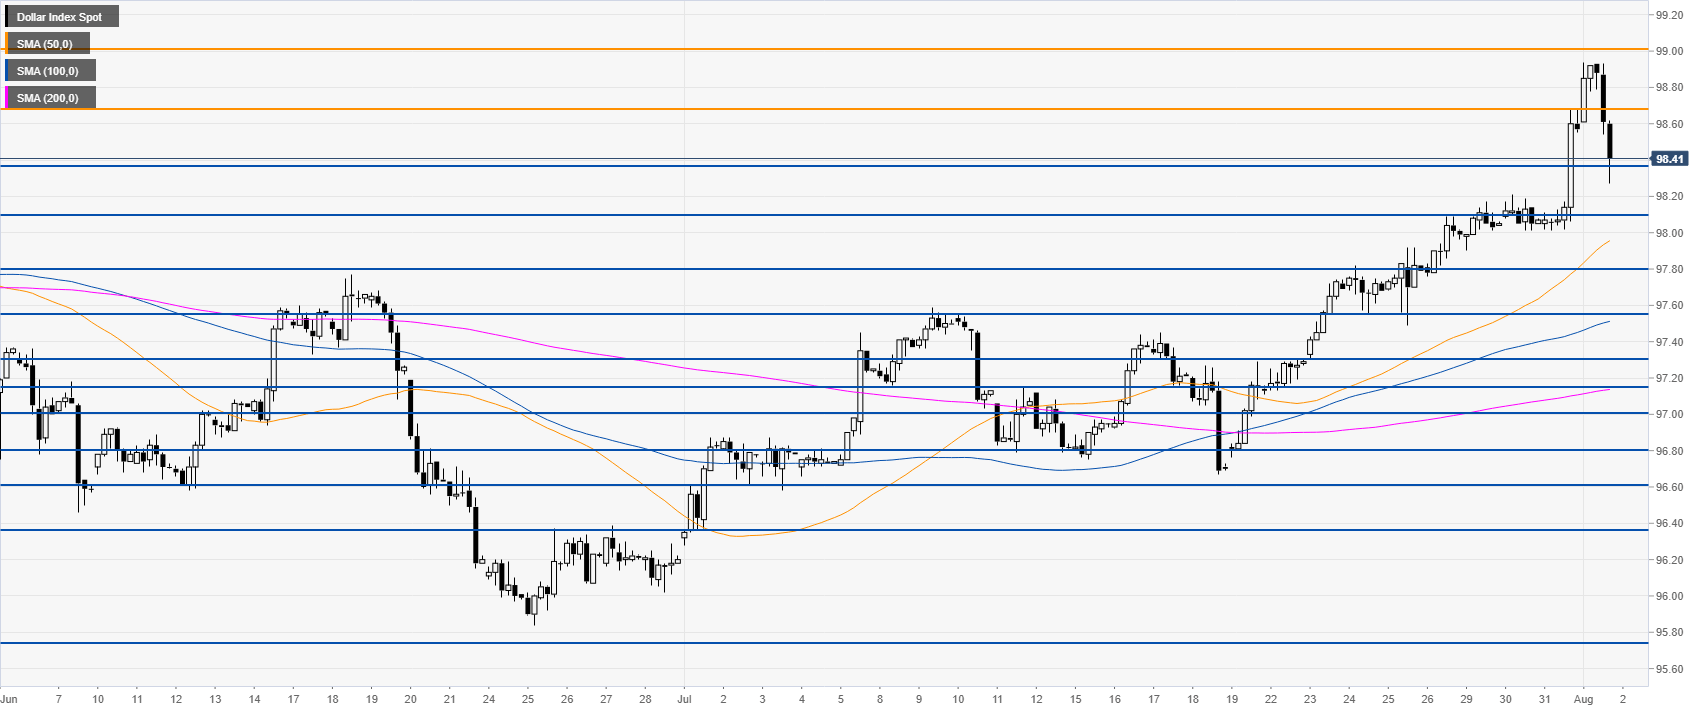
 

DXY 4-hour chart


DXY is trading above its main SMAs, suggesting bullish momentum in the medium term. However the market is retracing down sharply and the bulls would need to regain the 98.68 resistance to trade towards 98.93, the 2019 high. 
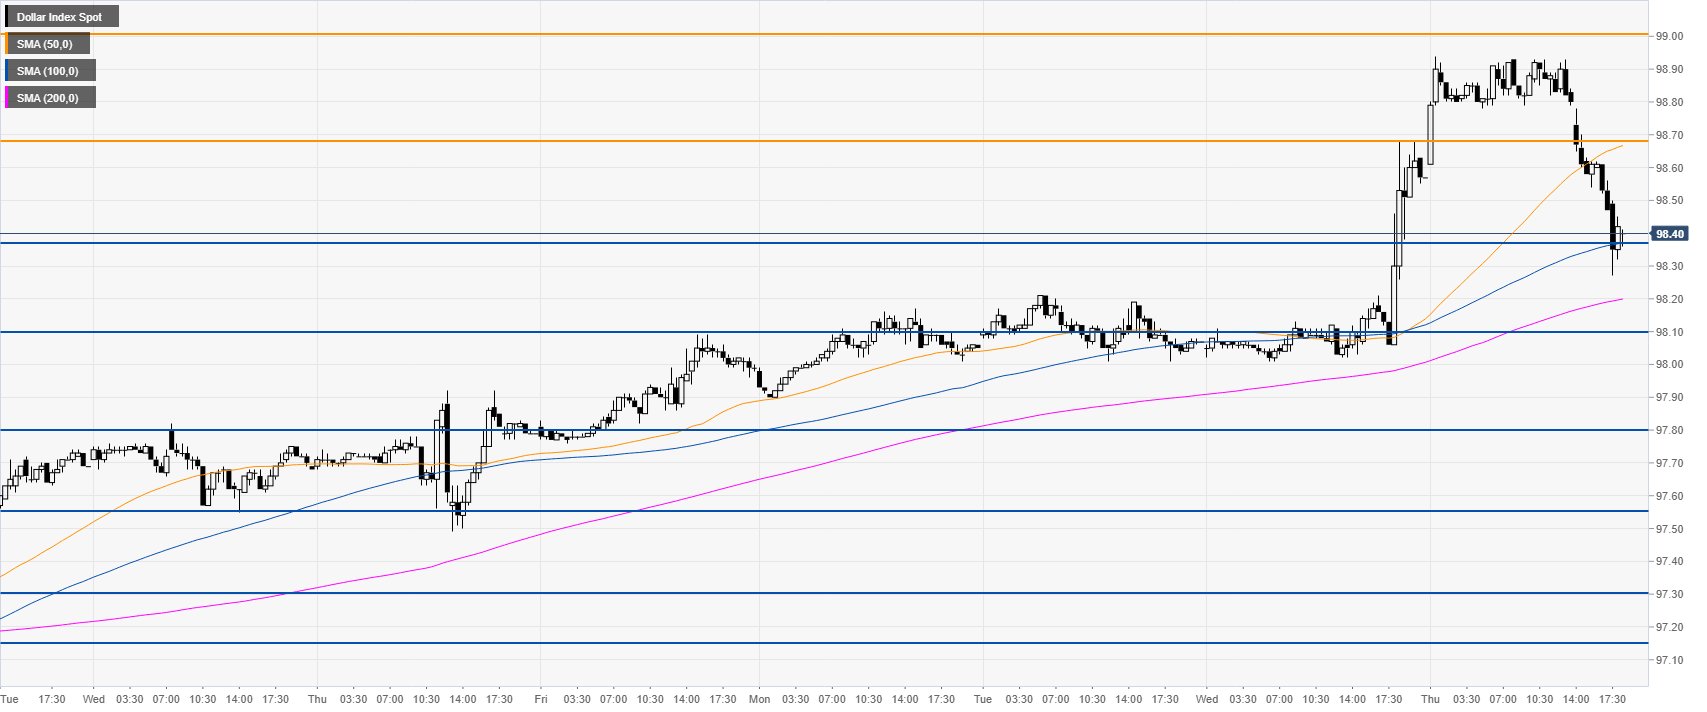
 

DXY 30-minute chart


DXY is testing the 98.38 support and the 100 SMA while trading below the 50 SMA, all-in-all suggesting a correction down in the near term. The move down can extend towards 98.38, 98.10 and 97.80 if the bears gather enough steam.


Additional key levels

Dollar Index Spot

Overview
Today last price98.42
Today Daily Change-0.15
Today Daily Change %-0.15
Today daily open98.57
 
Trends
Daily SMA2097.42
Daily SMA5097.21
Daily SMA10097.25
Daily SMA20096.91
Levels
Previous Daily High98.68
Previous Daily Low98.01
Previous Weekly High98.09
Previous Weekly Low97.13
Previous Monthly High98.68
Previous Monthly Low96.28
Daily Fibonacci 38.2%98.42
Daily Fibonacci 61.8%98.27
Daily Pivot Point S198.16
Daily Pivot Point S297.75
Daily Pivot Point S397.49
Daily Pivot Point R198.83
Daily Pivot Point R299.09
Daily Pivot Point R399.5

Author

Flavio Tosti

Flavio Tosti

Independent Analyst


More from Flavio Tosti
Share:

Editor's Picks

EUR/USD weakens toward 1.1600 as firm US data revives the US Dollar

The EUR/USD edged lower on Thursday, down some 0.21% as market sentiment remains risk averse due to the ongoing conflict in the Middle East. This and solid US economic data pushed the pair lower towards the 1.1600 figure ahead of Friday’s session.

GBP/USD stays offered near 1.3340

GBP/USD fades Wednesday’s uptick and trades with decent losses in the 1.3340 zone in the latter part of Thursday’s session. Cable’s weakness, alongside the rest of the risk complex, follows the strong performance of the Greenback amid intense geopolitical jitters.

Gold: further weakness could challenge $5,000

Gold comes under fresh selling pressure on Thursday, slipping back below the $5,100 mark per troy ounce. Persistent strength in the US Dollar (USD) is preventing the yellow metal from building a meaningful recovery, even as markets remain risk-averse amid the deepening conflict in the Middle East.

NYSE parent Intercontinental Exchange partners with OKX, invests at a $25B valuation

OKX announced an investment from Intercontinental Exchange, raising its valuation to $25 billion, alongside a partnership to expand regulated crypto futures and tokenized equity offerings globally.

Two PMIs, two Chinas

China’s economic data are often treated with a degree of caution by global investors. The challenge is not necessarily that the numbers are incorrect, but that they can describe very different parts of a vast and complex economy. Nowhere is that more evident than in China’s PMIs.

Ripple tests recovery strength amid steady ETF inflows, growing retail interest

Ripple (XRP) continues to demonstrate notable resilience as the cryptocurrency market navigates the persistent war in the Middle East after the United States (US) and Israel attacked Iran on Saturday.