US Dollar Index Technical Analysis: Greenback bulls can reach 96.50 level

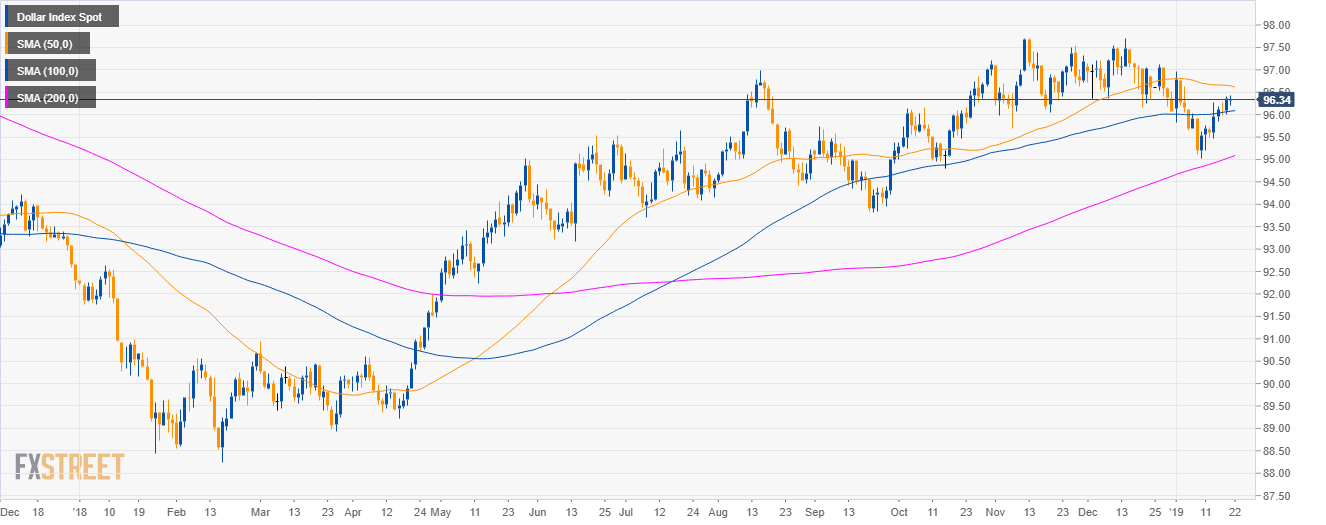
DXY daily chart
- DXY is trading in a bull trend above the 100 and 200-day simple moving average (SMA).
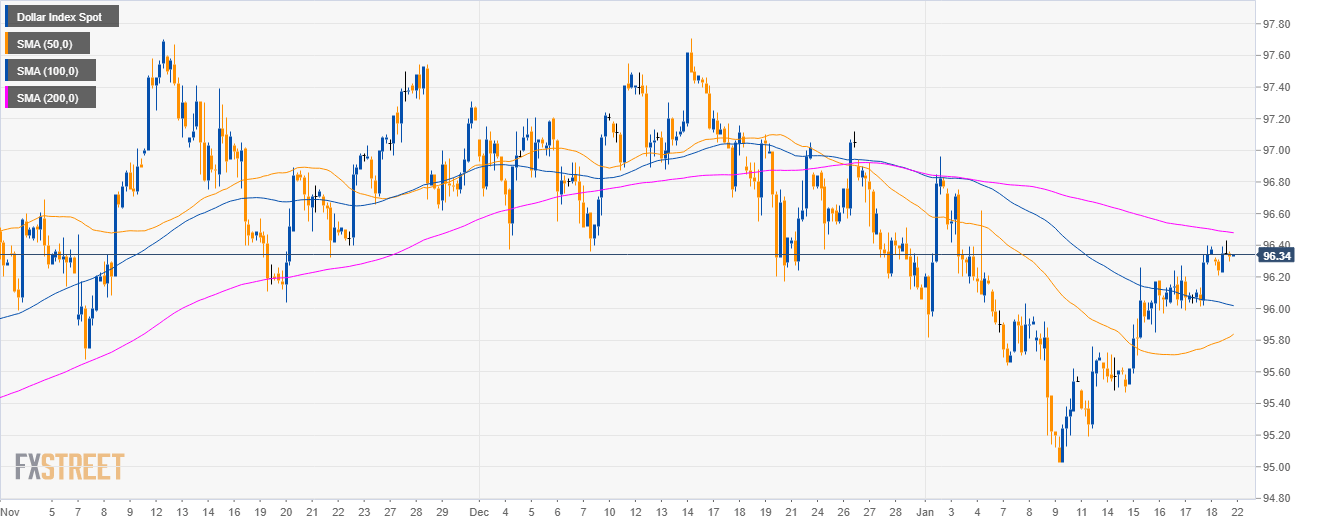
DXY 4-hour chart
- DXY bulls have reclaimed the 50 and 100 SMA but they need to overcome the 200 SMA.
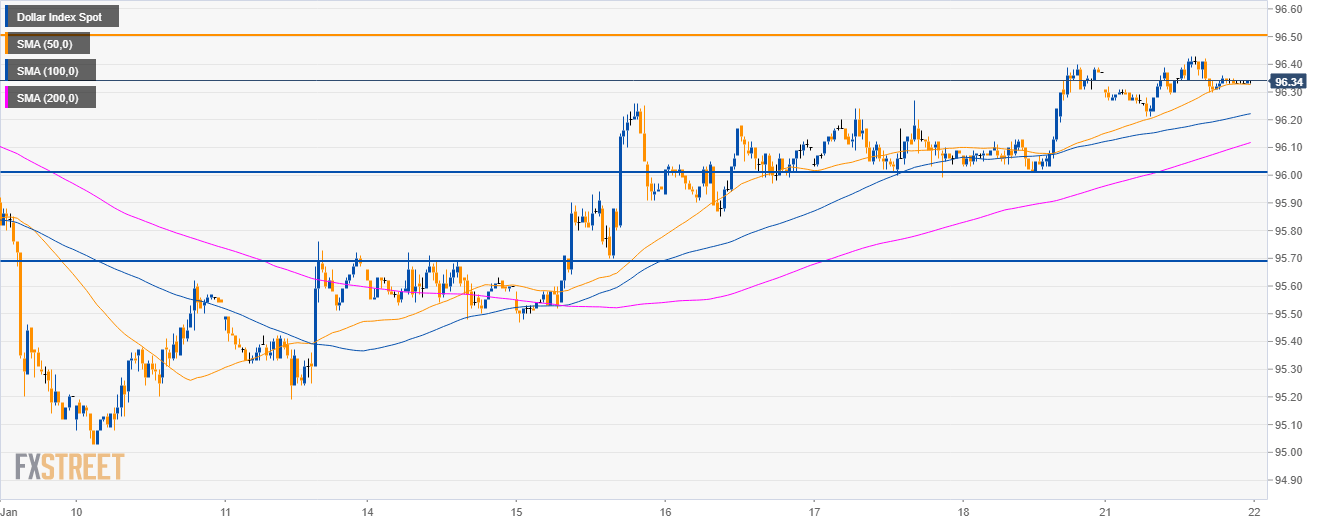
DXY 30-minute chart
- DXY bulls are still in charge and they might reach the 96.50 target as they have the momentum on their side.
- However, it is unlikely that any sustained move above 96.50 might go very far as 96.00 is still on the card for DXY bears.
Additional key levels
Dollar Index Spot
Overview:
Today Last Price: 96.34
Today Daily change: -0.03 pips
Today Daily change %: -0.03%
Today Daily Open: 96.37
Trends:
Daily SMA20: 96.18
Daily SMA50: 96.65
Daily SMA100: 96.07
Daily SMA200: 95.02
Levels:
Previous Daily High: 96.4
Previous Daily Low: 96.01
Previous Weekly High: 96.4
Previous Weekly Low: 95.47
Previous Monthly High: 97.71
Previous Monthly Low: 96.06
Daily Fibonacci 38.2%: 96.25
Daily Fibonacci 61.8%: 96.16
Daily Pivot Point S1: 96.12
Daily Pivot Point S2: 95.87
Daily Pivot Point S3: 95.73
Daily Pivot Point R1: 96.51
Daily Pivot Point R2: 96.65
Daily Pivot Point R3: 96.9
Author

Flavio Tosti
Independent Analyst


