|

US Dollar Index technical analysis: DXY under pressure nearing three-day lows

  • Weaker-than-expected data in the United States is weighing on the Greenback.
  • The level to beat for bears is the 99.00 figure. 
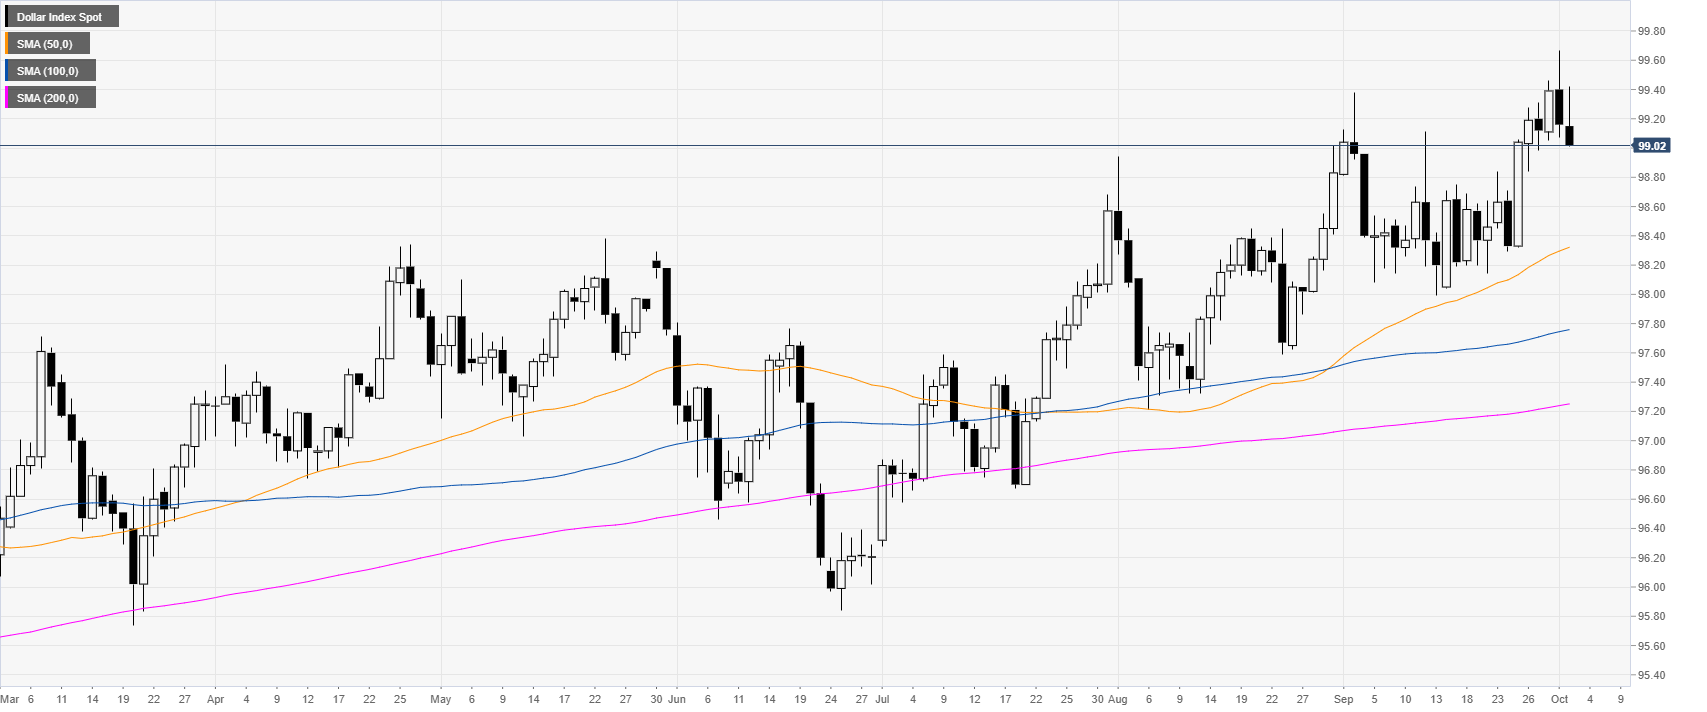
 

DXY daily chart

 
The US Dollar Index (DXY) is trading a bull trend above its main daily simple moving averages (DSMAs). In the New York session, the ADP, the forerunner of the Nonfarm Payrolls on Friday, disappointed the market with only 135k vs. 140k expected in September. This adds to the negative sentiment on the Greenback which started on Tuesday after the ISM Manufacturing PMI came in below expectations at 47.8 vs. 50.1 forecast. This was the worst reading since 2009 and sent the index lower. 
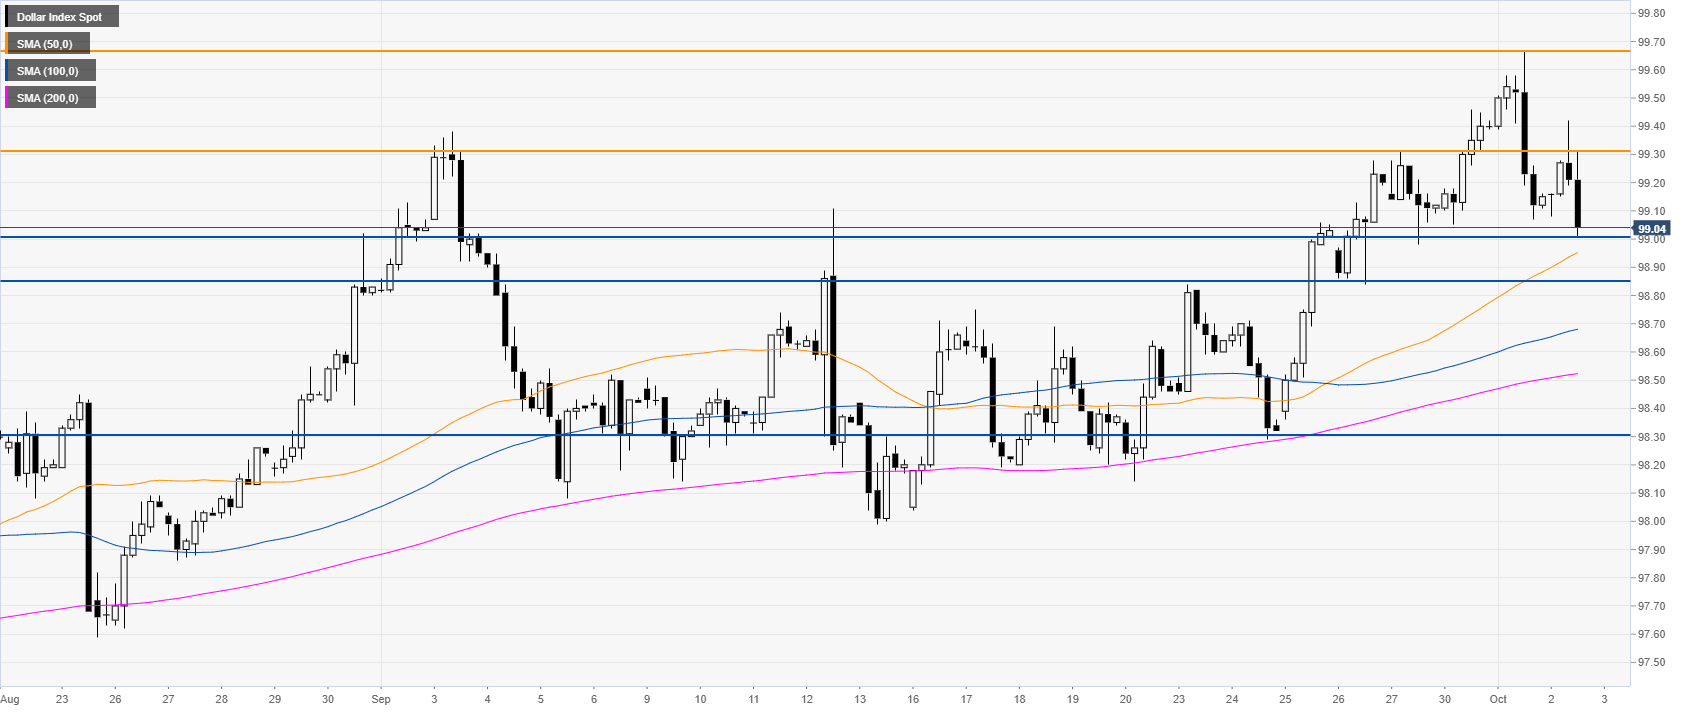
DXY four-hour chart

 
DXY is retracing down after hitting a new 2019 high at 99.67. The market is challenging the 99.00 figure. A break of the level can lead to 98.85 support area and potentially to 98.30 if the bears gather enough steam.
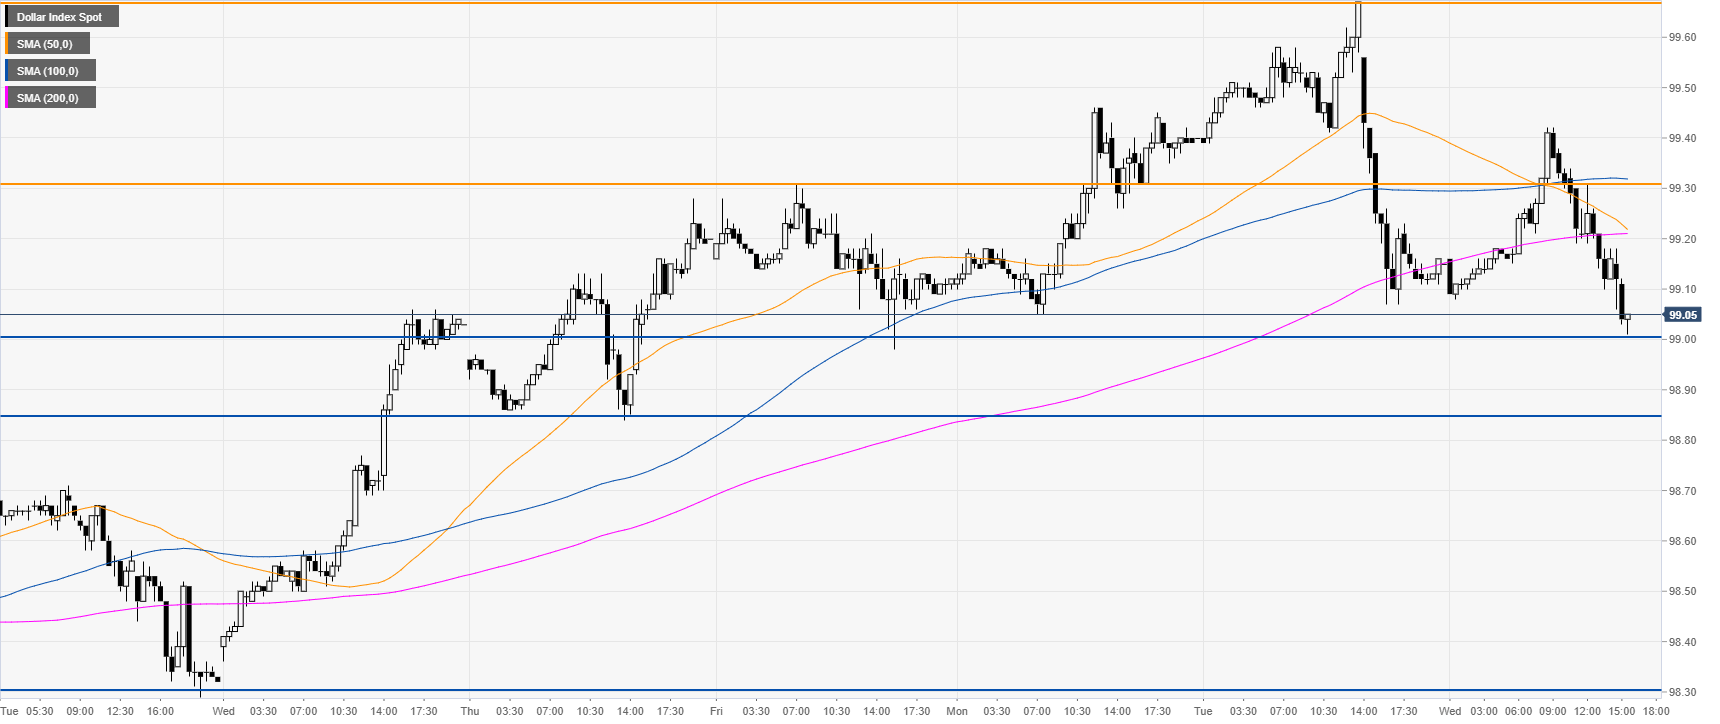
DXY 30-minute chart


DXY is trading below its main SMAs, suggesting a bearish bias in the short term. Immediate resistance is seen at the 99.30 price level and 99.67 (2019 high). 
 

Additional key levels 

Dollar Index Spot

Overview
Today last price99.01
Today Daily Change-0.15
Today Daily Change %-0.15
Today daily open99.16
 
Trends
Daily SMA2098.61
Daily SMA5098.3
Daily SMA10097.74
Daily SMA20097.24
 
Levels
Previous Daily High99.67
Previous Daily Low99.07
Previous Weekly High99.31
Previous Weekly Low98.29
Previous Monthly High99.46
Previous Monthly Low97.99
Daily Fibonacci 38.2%99.3
Daily Fibonacci 61.8%99.44
Daily Pivot Point S198.93
Daily Pivot Point S298.7
Daily Pivot Point S398.33
Daily Pivot Point R199.53
Daily Pivot Point R299.9
Daily Pivot Point R3100.13

Author

Flavio Tosti

Flavio Tosti

Independent Analyst


More from Flavio Tosti
Share:

Editor's Picks

EUR/USD flirts with daily highs, retargets 1.1900

EUR/USD regains upside traction, returning to the 1.1880 zone and refocusing its attention to the key 1.1900 barrier. The pair’s slight gains comes against the backdrop of a humble decline in the US Dollar as investors continue to assess the latest US CPI readings and the potential Fed’s rate path.

GBP/USD remains well bid around 1.3650

GBP/USD maintains its upside momentum in place, hovering around daily highs near 1.3650 and setting aside part of the recent three-day drop. Cable’s improved sentiment comes on the back of the Greenback’s  irresolute price action, while recent hawkish comments from the BoE’s Pill also collaborate with the uptick.

Gold clings to gains just above $5,000/oz

Gold is reclaiming part of the ground lost on Wednesday’s marked decline, as bargain-hunters keep piling up and lifting prices past the key $5,000 per troy ounce. The precious metal’s move higher is also underpinned by the slight pullback in the US Dollar and declining US Treasury yields across the curve.

Crypto Today: Bitcoin, Ethereum, XRP in choppy price action, weighed down by falling institutional interest 

Bitcoin's upside remains largely constrained amid weak technicals and declining institutional interest. Ethereum trades sideways above $1,900 support with the upside capped below $2,000 amid ETF outflows.

Week ahead – Data blitz, Fed Minutes and RBNZ decision in the spotlight

US GDP and PCE inflation are main highlights, plus the Fed minutes. UK and Japan have busy calendars too with focus on CPI. Flash PMIs for February will also be doing the rounds. RBNZ meets, is unlikely to follow RBA’s hawkish path.

Ripple Price Forecast: XRP potential bottom could be in sight

Ripple edges up above the intraday low of $1.35 at the time of writing on Friday amid mixed price actions across the crypto market. The remittance token failed to hold support at $1.40 the previous day, reflecting risk-off sentiment amid a decline in retail and institutional sentiment.