|

US Dollar Index technical analysis: DXY is on life support holding at one-week low near 98.63

  • DXY has been hammered down to one-week low. 
  • The market is holding at a key support level at the 98.63 price level. 
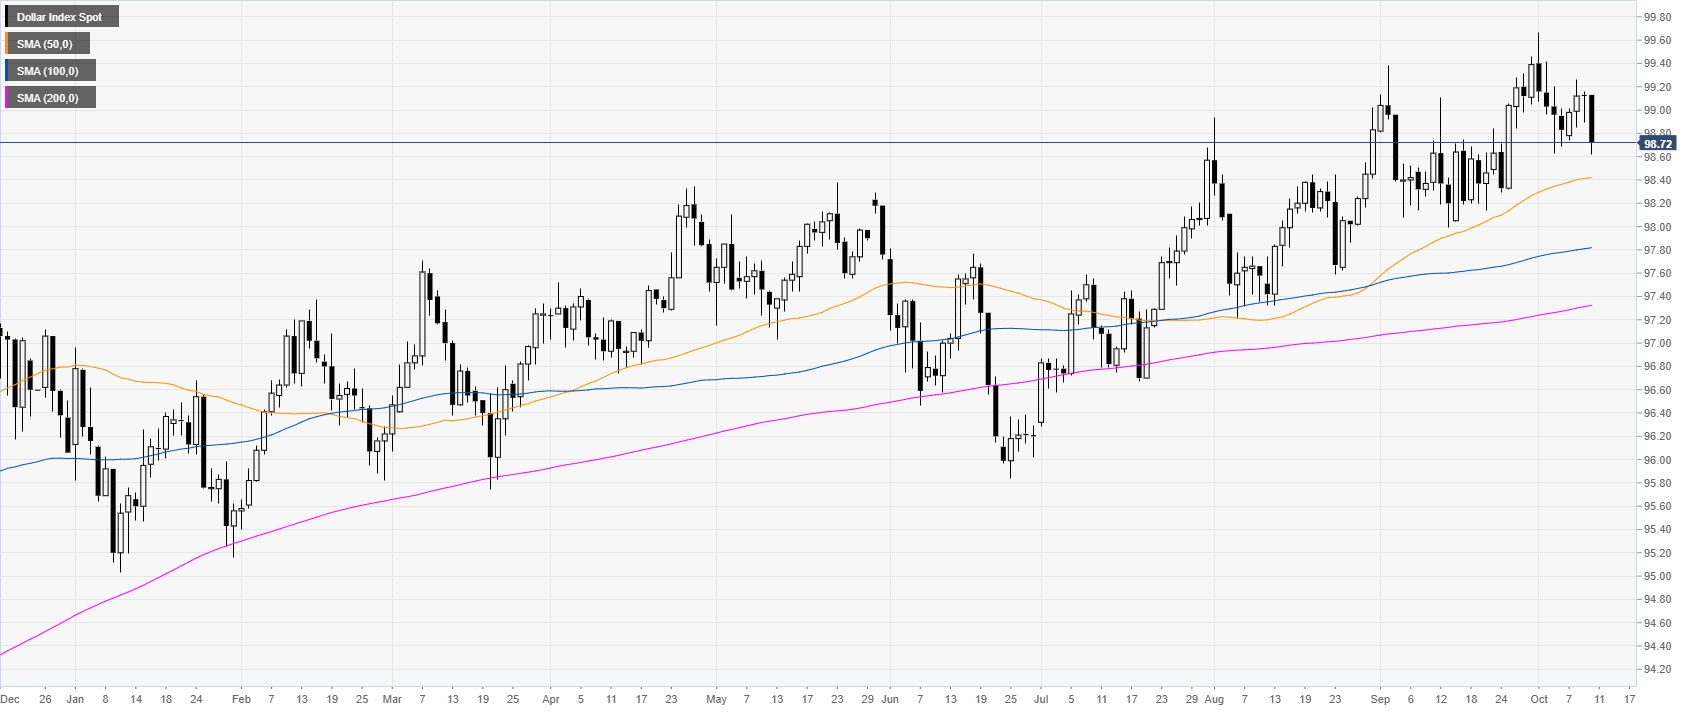
 

DXY daily chart

 
The US Dollar Index (DXY) is in a bull trend above the main daily simple moving averages (DSMAs). DXY fell as the European Central Bank Minutes showed opposition to QE (Quantitative Easing). In the New York session, the US Core Consumer Price Index (CPI) matched analysts’ expectations at 2.4% YoY. 
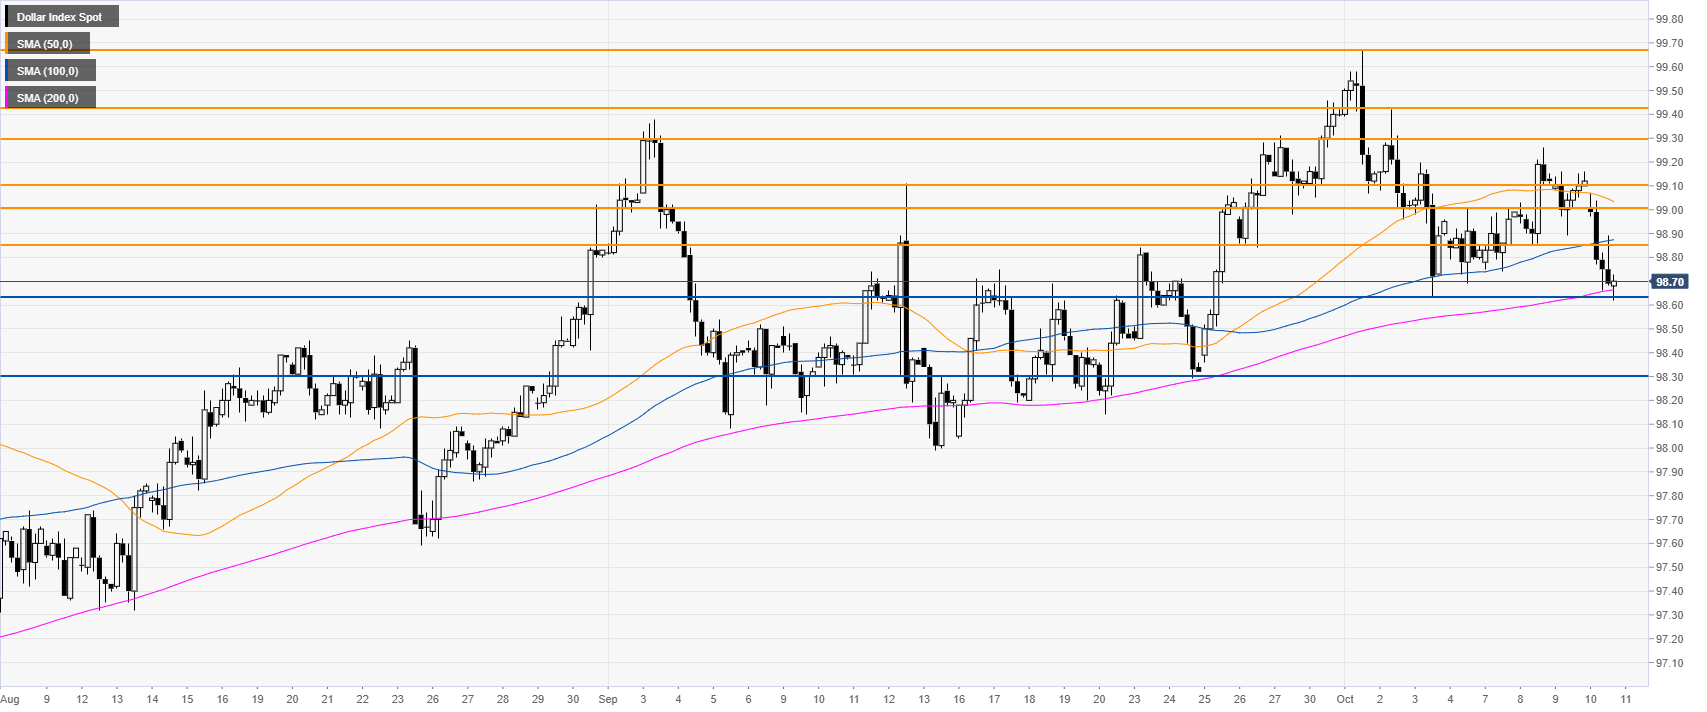
 

DXY four-hour chart

 
DXY is holding on at 98.63 key support near the 200 SMA on the four-hour chart. If the market can hold above this level DXY is set to continue its uptrend potentially revisiting the 99.00/99.10 zone. On the flips side, if the market loses the 96.63 level, then 98.30 can be on the cards for bears.
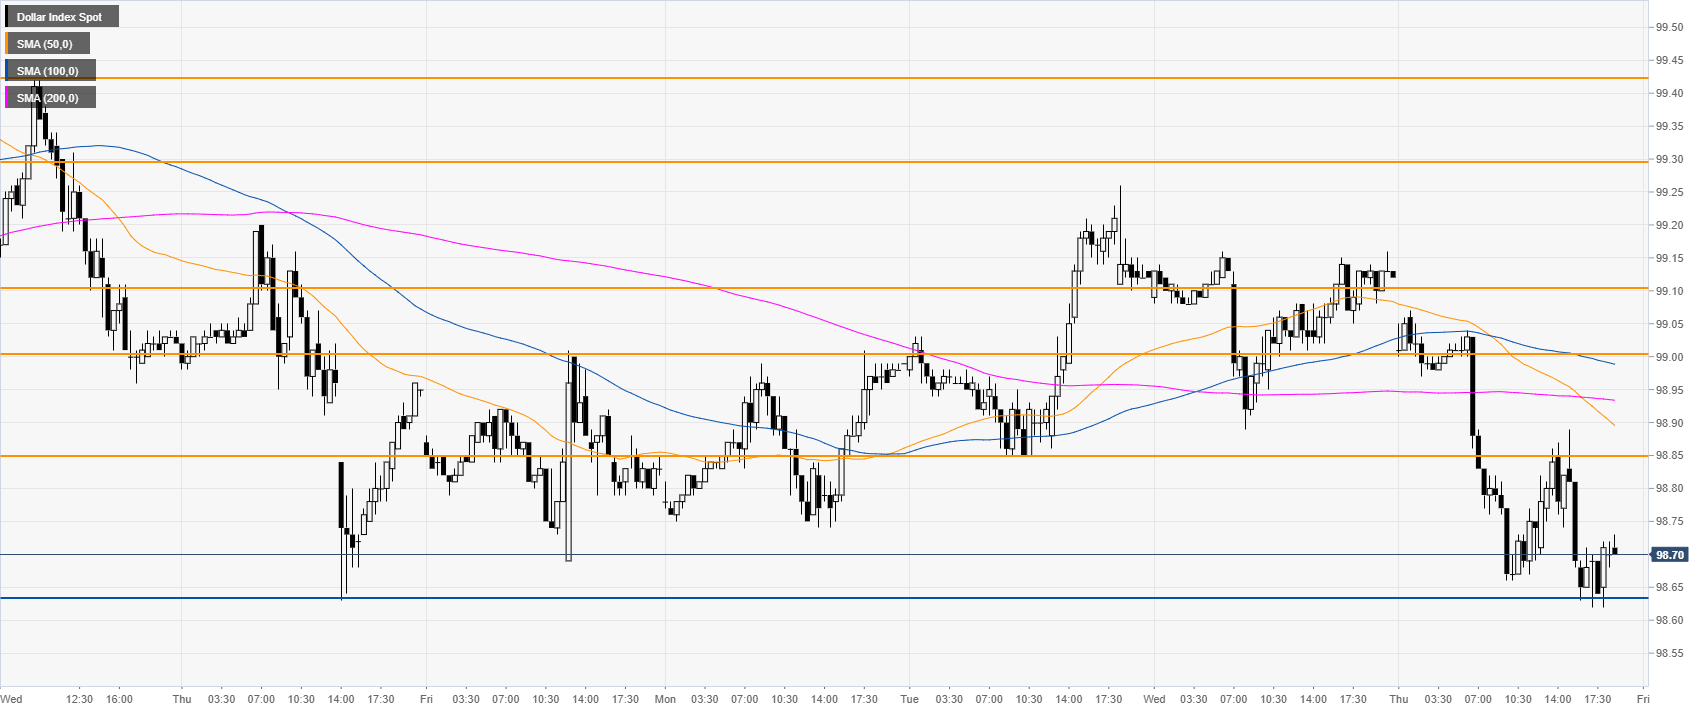


DXY 30-minute chart


DXY is trading below its main SMAs, suggesting a bearish momentum in the near term. Resistances are seen at the 98.85 and 99.00 price levels. 
 

Additional key levels 

Dollar Index Spot

Overview
Today last price98.72
Today Daily Change-0.41
Today Daily Change %-0.41
Today daily open99.13
 
Trends
Daily SMA2098.79
Daily SMA5098.41
Daily SMA10097.81
Daily SMA20097.31
 
Levels
Previous Daily High99.16
Previous Daily Low98.89
Previous Weekly High99.67
Previous Weekly Low98.63
Previous Monthly High99.46
Previous Monthly Low97.99
Daily Fibonacci 38.2%99.06
Daily Fibonacci 61.8%98.99
Daily Pivot Point S198.96
Daily Pivot Point S298.79
Daily Pivot Point S398.69
Daily Pivot Point R199.23
Daily Pivot Point R299.33
Daily Pivot Point R399.5

Author

Flavio Tosti

Flavio Tosti

Independent Analyst


More from Flavio Tosti
Share:

Editor's Picks

EUR/USD flirts with weekly lows near 1.1770

EUR/USD now comes under further selling pressure, breaking below the 1.1800 support to challenge the area of weekly throughs near 1.1770 on Thursday. The pair’s decline comes in response to marked gains in the US Dollar amid steady geopolitical tensions. Ealier in the day, the ECB’s Lagarde delivered cautious remarks, although the currency remained apathetic.

GBP/USD threatens the 200-day SMA near 1.3440

GBP/USD rapidly leaves behind Wednesday’s strong advance, coming under heavy pressure and retesting the 1.3440 zone, where the critical 200-day SMA is located. Cable’s deep pullback follows the strong gains in the Greenback, while investors continue to pencil in a potential BoE rate cut in March.

Gold trims gains, slips back to around $5,170

Gold is now facing some downside pressure, hovering around the $5,170 region on Thursday. The yellow metal surrenders part of its earlier gains on the back of the resurgence of the buying interest in the Greenback. In the meantime, geopolitical tensions in the Middle East continue to limit the downside potential for now.

Stellar: Relief bounce fades as bearish undertone persists

Stellar is trading around $0.16 at the time of writing on Thursday after rebounding more than 8% in the previous day. Derivatives data paints a negative picture as XLM’s short bets hit a monthly high while Open Interest continues to decline.

Changing the game: International implications of recent tariff developments

The Supreme Court ruling on International Emergency Economic Powers Act (IEEPA) tariffs provides limited relief for the rest of the world, with weighted average tariff rates modestly lower.

Bitcoin steadies as traders eye US–Iran talks

Bitcoin (BTC) price is stabilizing around $68,000 at the time of writing on Thursday after a 6.2% relief rally the previous day amid a broader downward trend.