|
US Dollar Index technical analysis: DXY is nearing the 2019 high
- The Greenback broke above the 99.10 resistance.
- The market is approaching the 2019 high at 99.38.

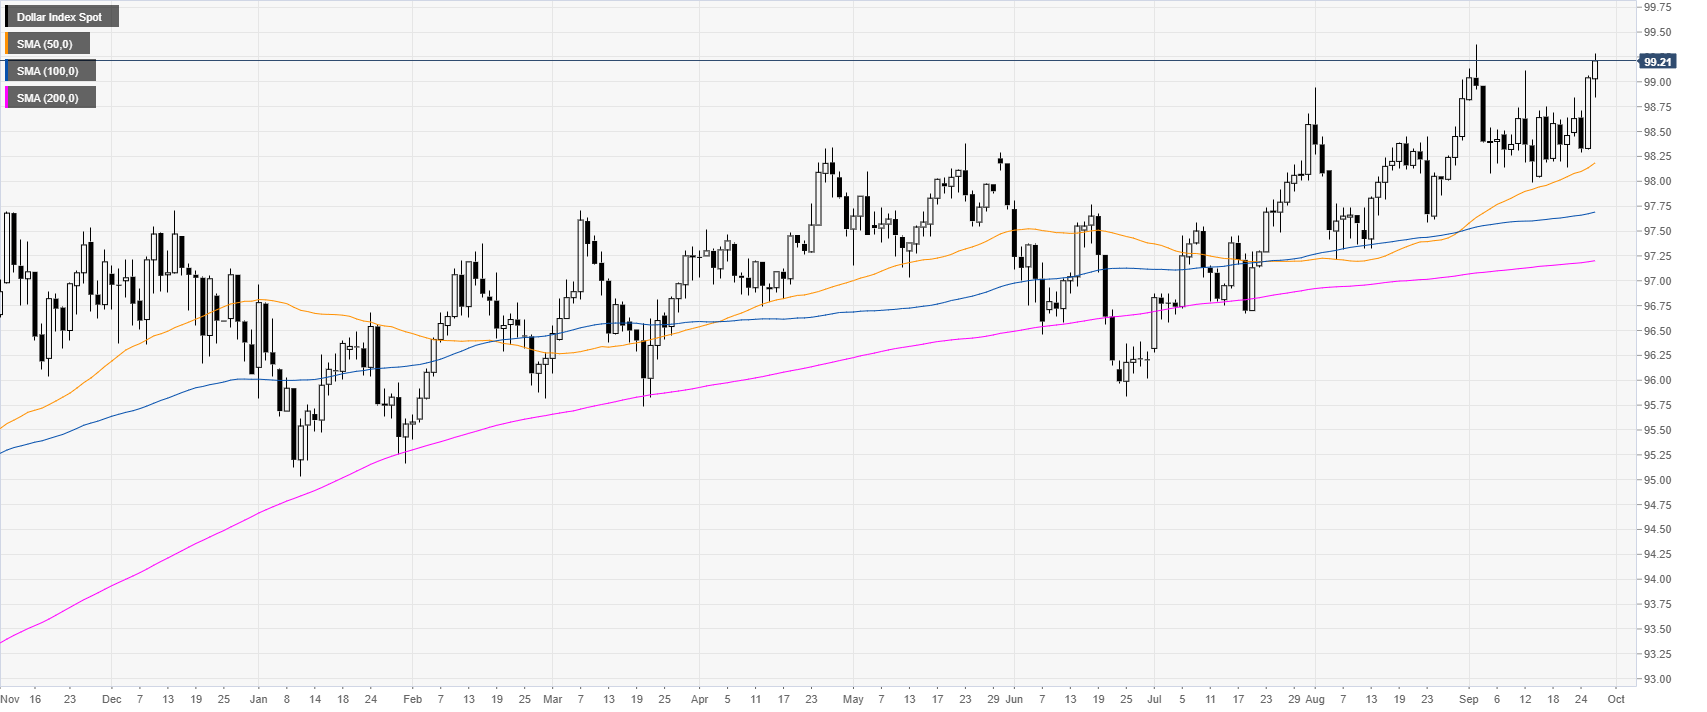
DXY daily chart
DXY (US Dollar Index) is an uptrend above the main daily simple moving averages (DSMAs). The market is approaching the 2019 high at 99.38.
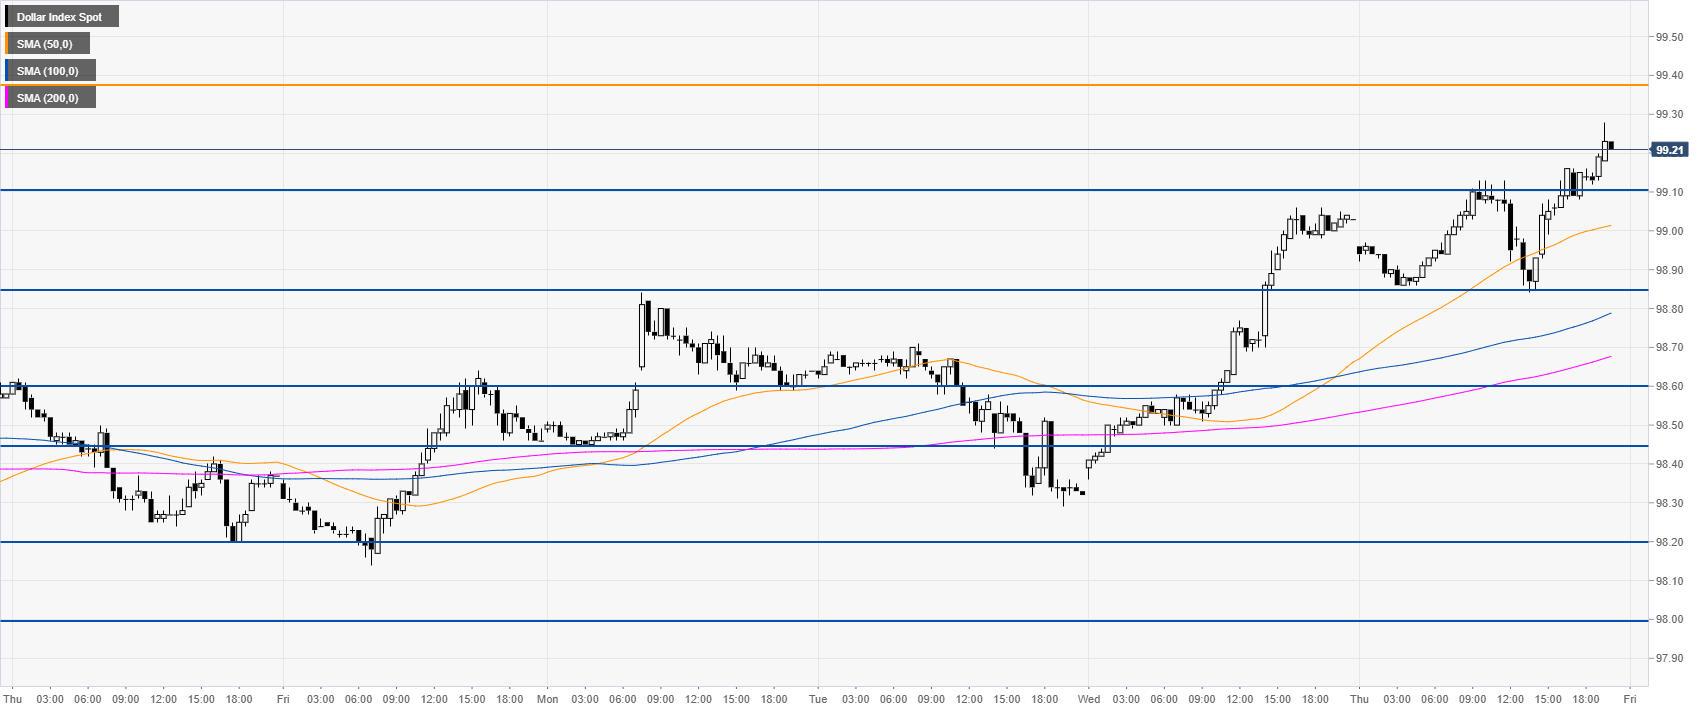
DXY four-hour chart
DXY rose above the 99.10 resistance as the market is trading above the SMAs. The market is now at a stone’s throw from the 2019 high at 99.38. It will be interesting to see if this Friday the market will get there. A break above 99.38 can lead to the 100.00 big figure.

DXY 30-minute chart
DXY is trading above its main SMAs, suggesting a bullish bias in the short term. Immediate support is seen at the 98.85 and 98.60 price level.
Additional key levels
Author

Flavio Tosti
Independent Analyst
More from Flavio Tosti


