|
US Dollar Index technical analysis: DXY flirting with daily lows below the 97.00 mark
- DXY is trading near the daily lows below the 97.00 handle.
- A break below 96.80 support caould lead to more down.

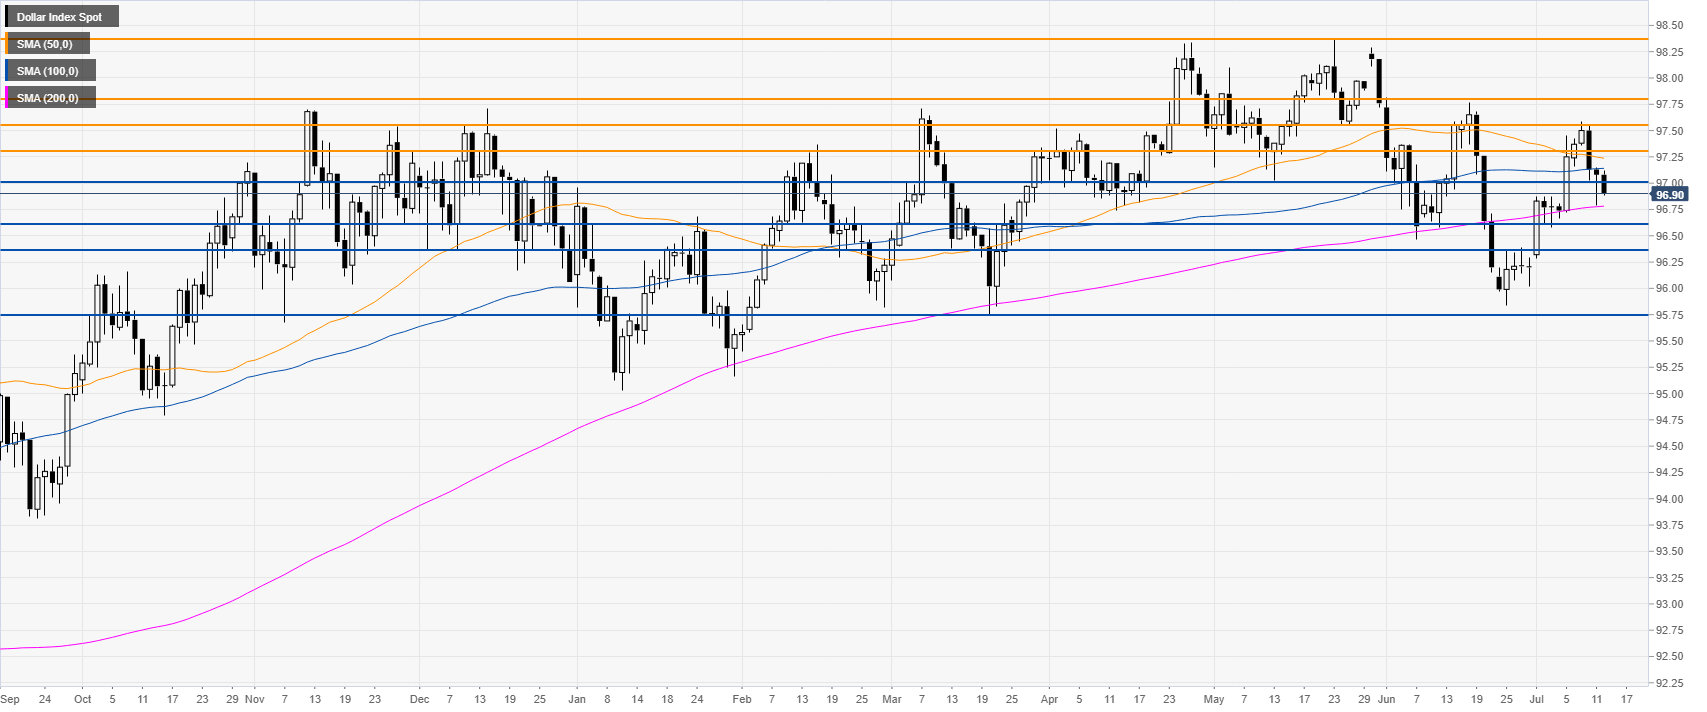
DXY daily chart
The US Dollar Index (DXY) is trading in a bull trend above the 200-day simple moving average (DSMA). DXY is trading at daily lows.
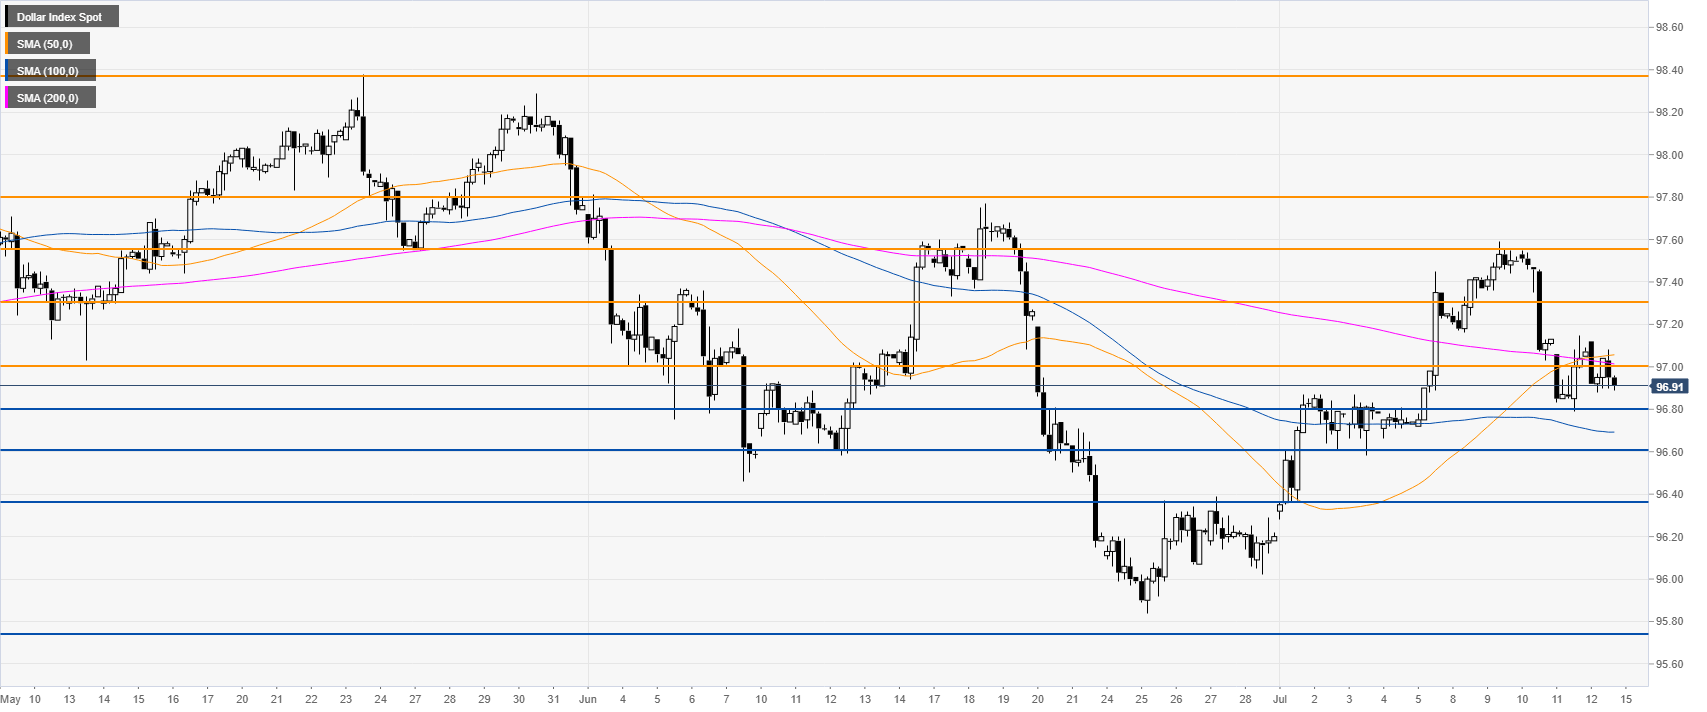
DXY 4-hour chart
The market is under bearish pressure below the 97.00 handle and the 50/200 SMA. A breach below 96.80 could lead to 96.60 and 96.37.
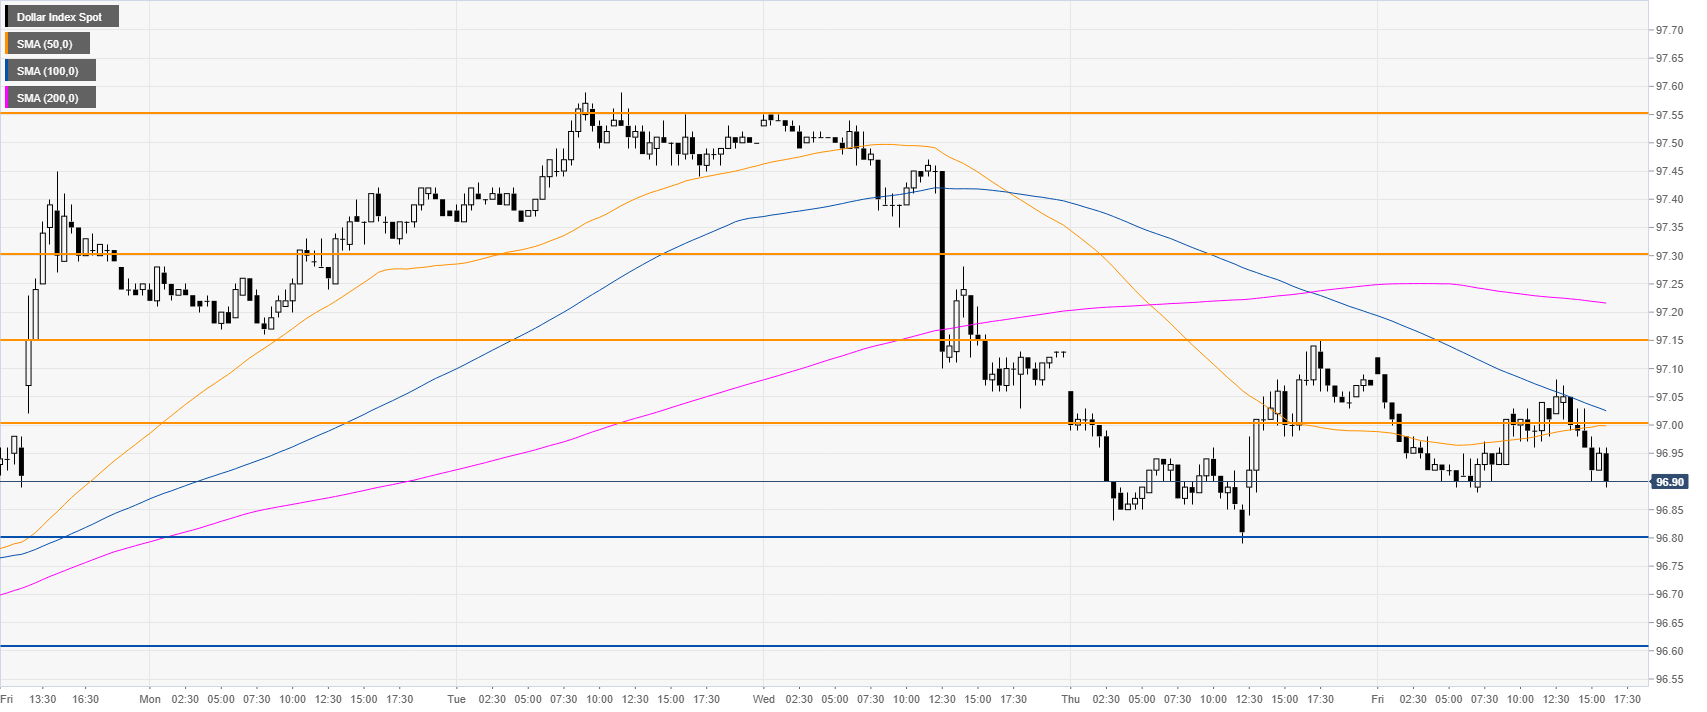
DXY 30-minute chart
DXY is trading below its main SMAs suggesting bearish momentum in the near term. Immediate resistances are seen at 97.00 and 97.15.
Additioinal key levels
Author

Flavio Tosti
Independent Analyst
More from Flavio Tosti


