|
US Dollar Index technical analysis: DXY challenging the 98.40 resistance
- DXY is trading off the daily highs after testing the 98.40 resistance.
- The level to beat for bulls is the 98.40 resistance level.

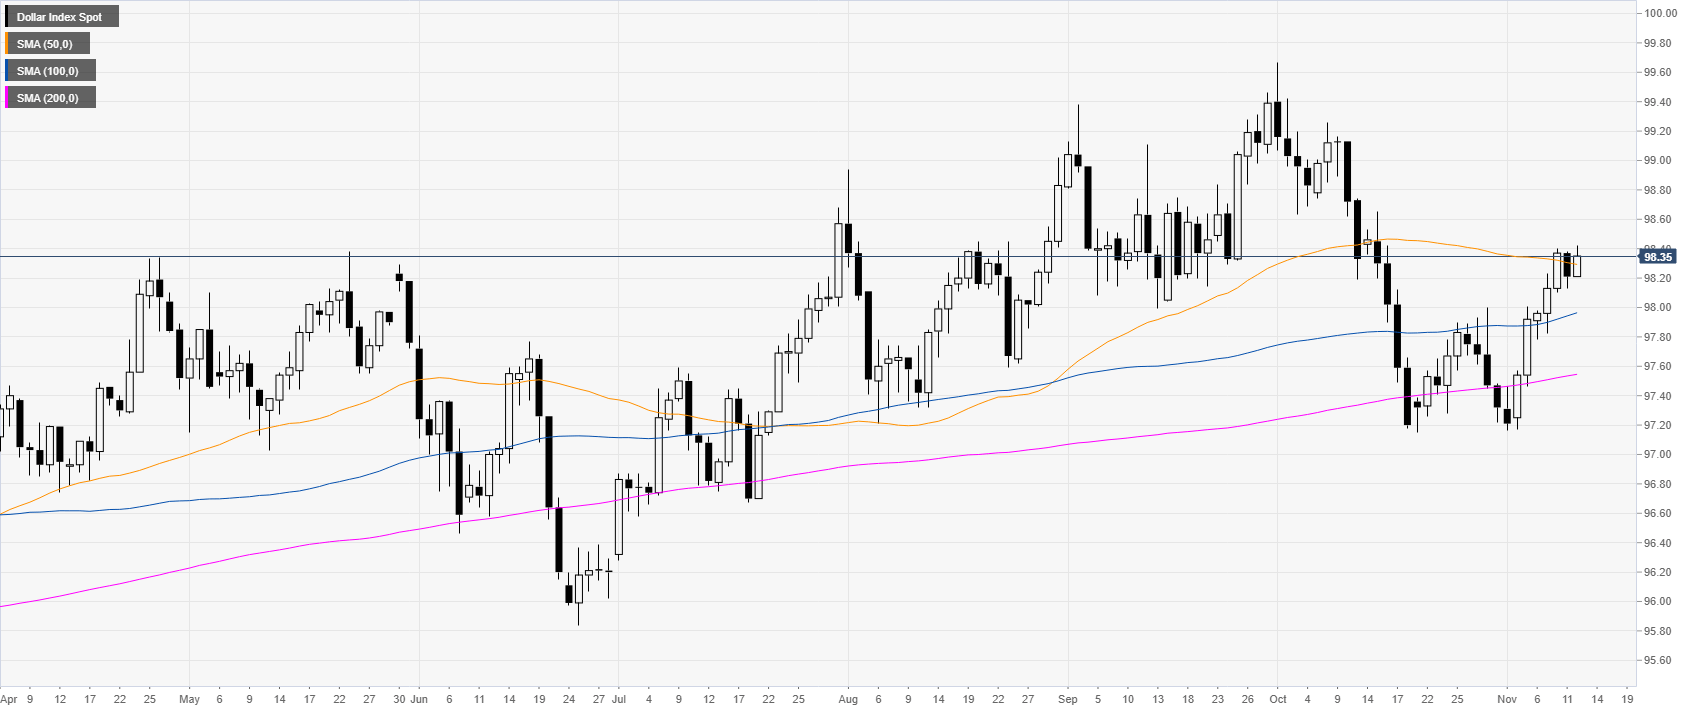
DXY daily chart
DXY (US Dollar Index) is trading in an uptrend above its main daily simple moving averages (DMAs). This Tuesday the Greenback is holding above the 98.20 level and the 50 DMA.
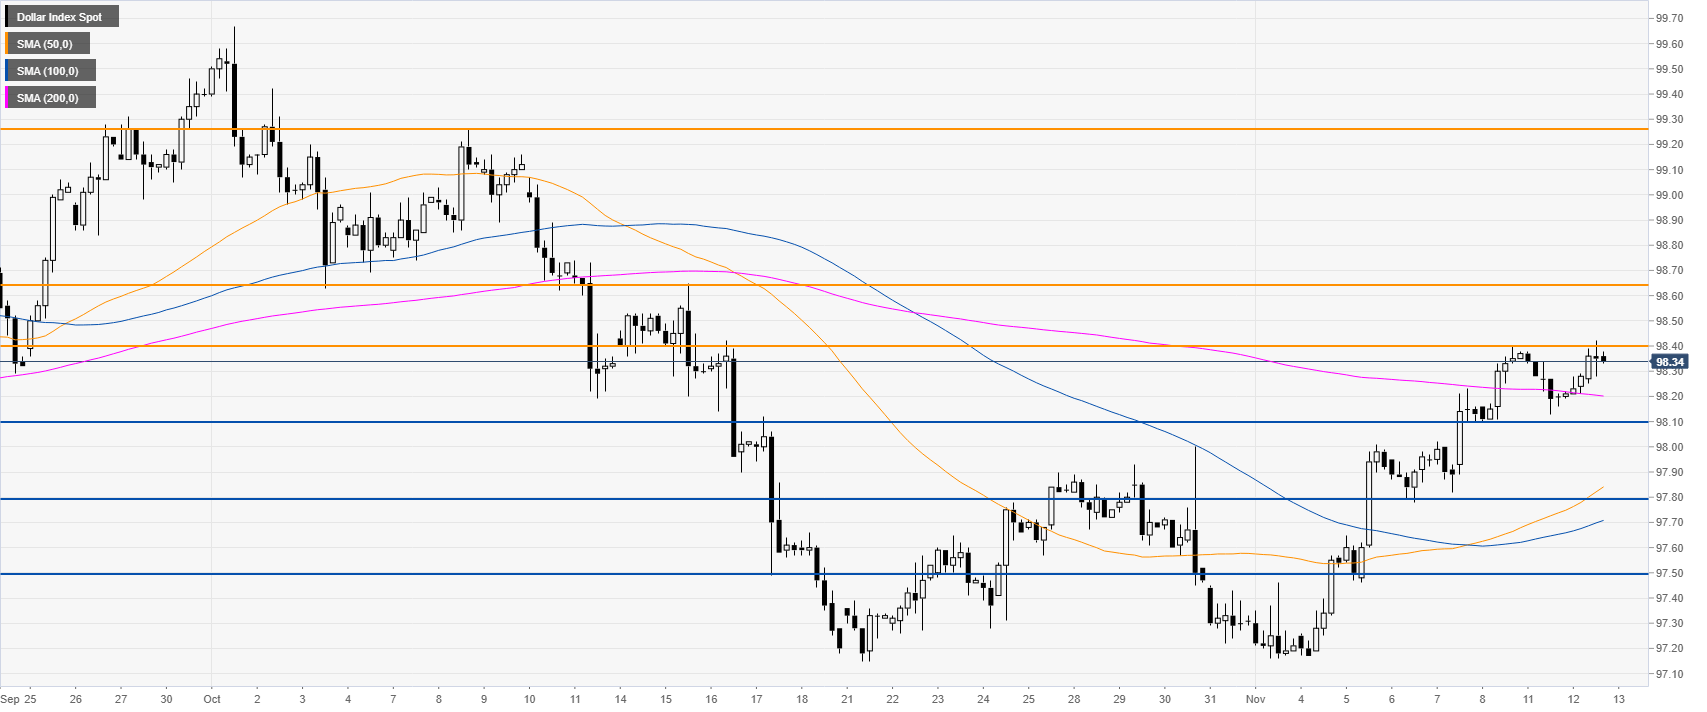
DXY 4-hour chart
DXY is challenging the 98.40 resistance while trading above its main SMAs. The market is likely looking for a break above the 98.40 resistance level to travel towards the 98.65 and the 99.26 resistances on the way up.
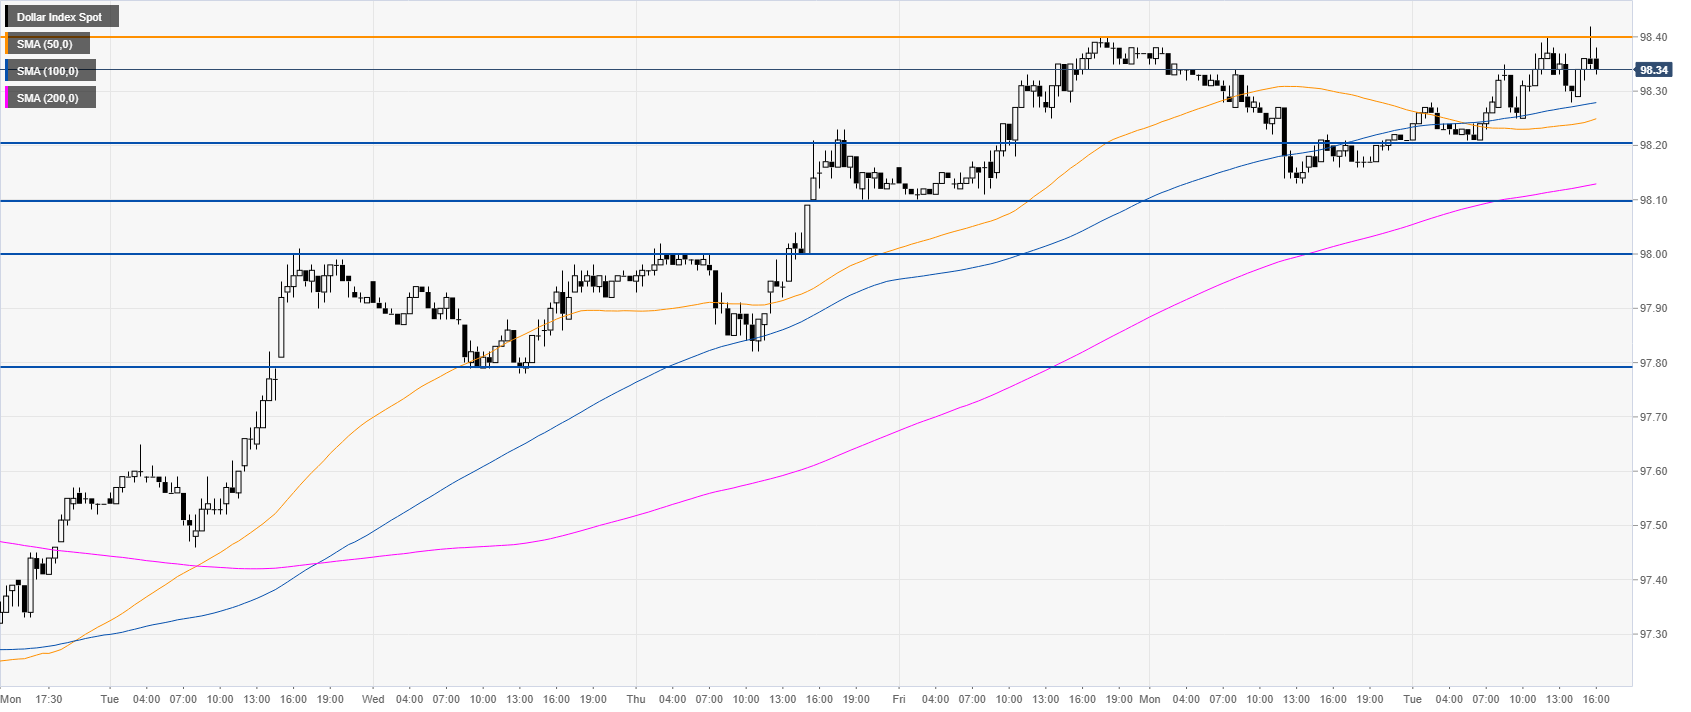
DXY 30-minute chart
DXY is trading above its main SMAs, suggesting bullish momentum in the short term. Support is seen at the 98.20/10 support zone followed by the 98.00 handle. Further down lie the 97.80 level.
Additional key levels
Author

Flavio Tosti
Independent Analyst
More from Flavio Tosti


