|

US Dollar Index Technical Analysis: DXY bulls counter-attack - 96.00 target
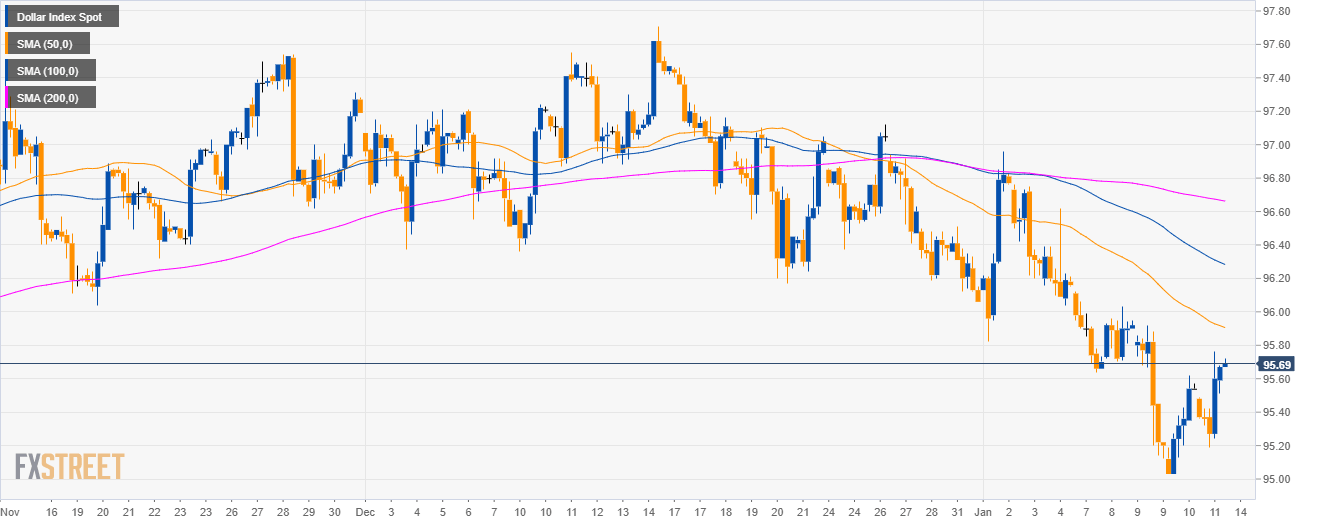
DXY daily chart

  • The US Dollar Index (DXY) is trading in a bull trend above the 200-period simple moving average (SMA). 
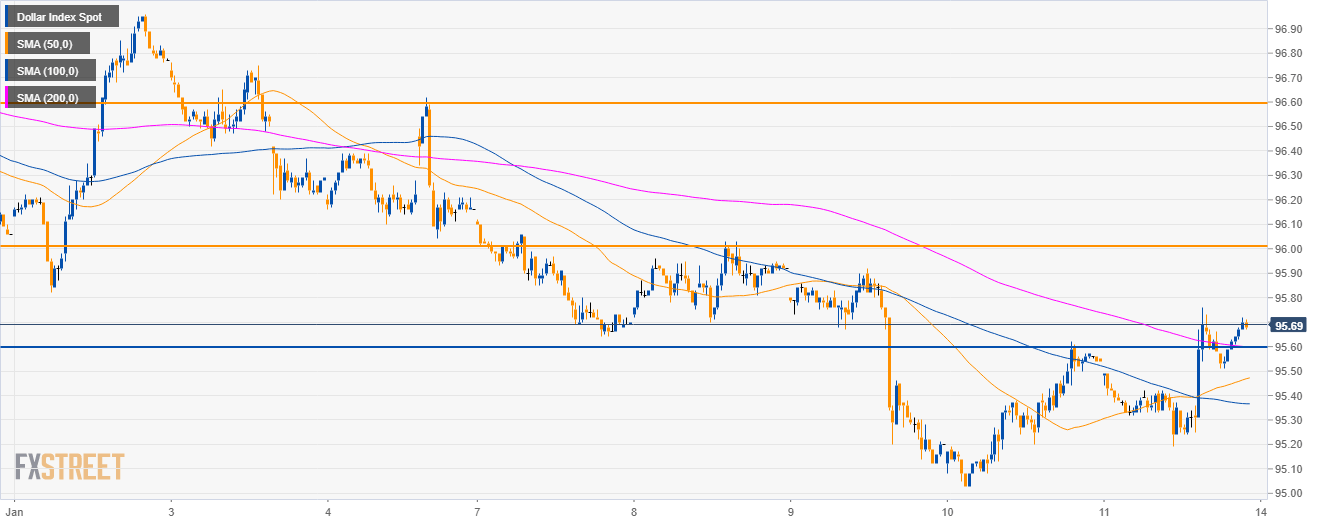
DXY 4-hour chart

  • DXY is having a bullish reversal as the market found support at the 95.00 figure.

DXY 30-minute chart

  • Bulls have reclaimed the main SMAs.
  • 95.60 target has been achieved, the next objective for bulls is the 96.00 figure. 

Additional key levels

Dollar Index Spot

Overview:
    Today Last Price: 95.69
    Today Daily change: 15 pips
    Today Daily change %: 0.157%
    Today Daily Open: 95.54
Trends:
    Previous Daily SMA20: 96.5
    Previous Daily SMA50: 96.7
    Previous Daily SMA100: 96
    Previous Daily SMA200: 94.84
Levels:
    Previous Daily High: 95.62
    Previous Daily Low: 95.03
    Previous Weekly High: 96.96
    Previous Weekly Low: 95.82
    Previous Monthly High: 97.71
    Previous Monthly Low: 96.06
    Previous Daily Fibonacci 38.2%: 95.39
    Previous Daily Fibonacci 61.8%: 95.26
    Previous Daily Pivot Point S1: 95.17
    Previous Daily Pivot Point S2: 94.81
    Previous Daily Pivot Point S3: 94.58
    Previous Daily Pivot Point R1: 95.76
    Previous Daily Pivot Point R2: 95.99
    Previous Daily Pivot Point R3: 96.35

Author

Flavio Tosti

Flavio Tosti

Independent Analyst


More from Flavio Tosti
Share:

Editor's Picks

EUR/USD holds lower ground near 1.1850 ahead of EU/ US data

EUR/USD remains in the negative territory for the fourth successive session, trading around 1.1850 in European trading on Friday. A broadly cautious market environment paired with modest US Dollar demand undermines the pair ahead of the Eurozone GDP second estimate and the critical US CPI data. 

GBP/USD keeps losses around 1.3600, awaits US CPI for fresh impetus

GBP/USD holds moderate losses at around 1.3600 in the European session on Friday, though it lacks bearish conviction. The US Dollar remains supported amid softer risk tone and ahead of the US consumer inflation figures due later in the NA session on Friday. 

Gold trims intraday gains to $5,000 as US inflation data loom

Gold retreats from the vicinity of the $5,000 psychological mark, though sticks to its modest intraday gains heading into the European session. Traders now look forward to the release of the US consumer inflation figures for more cues about the Fed policy path. The outlook will play a key role in influencing the near-term US Dollar price dynamics and provide some meaningful impetus to the non-yielding bullion.

Solana: Mixed market sentiment caps recovery

Solana is trading at $79 as of Friday, following a correction of over 9% so far this week. On-chain and derivatives data indicates mixed sentiment among traders, further limiting the chances of a price recovery.

A tale of two labour markets: Headline strength masks underlying weakness

Undoubtedly, yesterday’s delayed US January jobs report delivered a strong headline – one that surpassed most estimates. However, optimism quickly faded amid sobering benchmark revisions.

Solana Price Forecast: Mixed market sentiment caps recovery

Solana (SOL) is trading at $79 as of Friday, following a correction of over 9% so far this week. On-chain and derivatives data indicates mixed sentiment among traders, further limiting the chances of a price recovery.