- DXY fades Thursday’s advance and returns to 93.60.
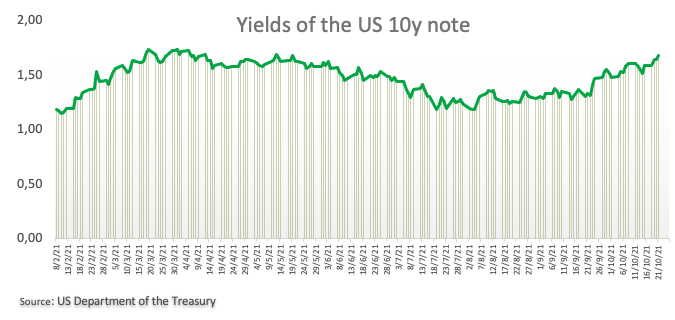
- US yields fade part of the recent upside on Friday.
- Flash PMIs next of relevance in the US docket.
The US Dollar Index (DXY), which gauges the greenback vs. a bundle of its main rival currencies, resumes the downside and re-visits the 93.65/60 band at the end of the week.
US Dollar Index looks to data, yields
The index quicky fades Thursday’s uptick and resumes the downtrend at the end of the week, retesting at the same time the vicinity of the 93.60 region on Friday.
The resumption of the offered stance in the buck comes in response to the pullback in US yields from recent tops: the front end of the curve recedes to the 0.45% yardstick, while the belly and the long end retreat to the 1.68% area and to the 2.12% zone, respectively.
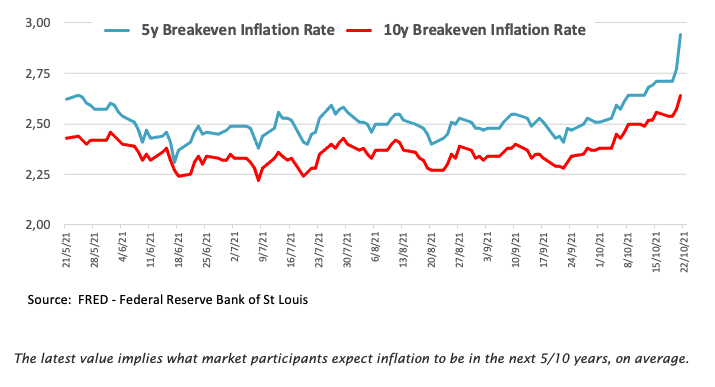
In the meantime, inflation concerns return to the fore following the abrupt increase in the 5y breakeven to the boundaries of the key 3.0% mark, while the 10y breakeven approach the 2.65% level.
Later in the US calendar, Markit will publish its preliminary PMIs for the month of October, in what will be the sole data releases on Friday.
What to look for around USD
The index remains under pressure and returns to the area of recent lows, always reflecting the performance of the US cash market. The corrective move in the dollar came in response to the repricing of several central banks particularly in light of elevated inflation and the subsequent improvement in the risk complex. Supportive Fedspeak, an anticipated start of the tapering process, higher yields and the rising probability that high inflation could linger for longer remain as the exclusive factors behind the constructive outlook for the buck in the near-to-medium term.
Key events in the US this week: Flash Manufacturing PMI (Friday).
Eminent issues on the back boiler: Persistent uncertainty around Biden’s multi-billion Build Back Better plan. US-China trade conflict under the Biden’s administration. Tapering speculation vs. economic recovery. Debt ceiling debate. Geopolitical risks stemming from Afghanistan.
US Dollar Index relevant levels
Now, the index is losing 0.13% at 93.64 and a break above 94.17 (weekly high Oct.18) would open the door to 94.56 (2021 high Oct.12) and then 94.74 (monthly high Sep.25 2020). On the flip side, the next down barrier emerges at 93.49 (monthly low October 21) followed by 93.25 (55-day SMA) and finally 92.98 (weekly low Sep.23).
Information on these pages contains forward-looking statements that involve risks and uncertainties. Markets and instruments profiled on this page are for informational purposes only and should not in any way come across as a recommendation to buy or sell in these assets. You should do your own thorough research before making any investment decisions. FXStreet does not in any way guarantee that this information is free from mistakes, errors, or material misstatements. It also does not guarantee that this information is of a timely nature. Investing in Open Markets involves a great deal of risk, including the loss of all or a portion of your investment, as well as emotional distress. All risks, losses and costs associated with investing, including total loss of principal, are your responsibility. The views and opinions expressed in this article are those of the authors and do not necessarily reflect the official policy or position of FXStreet nor its advertisers. The author will not be held responsible for information that is found at the end of links posted on this page.
If not otherwise explicitly mentioned in the body of the article, at the time of writing, the author has no position in any stock mentioned in this article and no business relationship with any company mentioned. The author has not received compensation for writing this article, other than from FXStreet.
FXStreet and the author do not provide personalized recommendations. The author makes no representations as to the accuracy, completeness, or suitability of this information. FXStreet and the author will not be liable for any errors, omissions or any losses, injuries or damages arising from this information and its display or use. Errors and omissions excepted.
The author and FXStreet are not registered investment advisors and nothing in this article is intended to be investment advice.
Recommended content
Editors’ Picks
EUR/USD trades weak below 1.0800 amid Good Friday lull, ahead of US PCE
EUR/USD remains depressed below 1.0800 after soft French inflation data, amid minimal volatility and thin liquidity on Good Friday. The pair keenly awaits the US PCE inflation data and Fed Chair Powell's speech for fresh hints on next week's price action.
GBP/USD holds steady above 1.2600 as markets stay calm on Good Friday
GBP/USD trades sideways above 1.2600 amid a typical Good Friday trading lull. A broadly firmer US Dollar could keep any upside attempts limited in the pair ahead of the US PCE inflation data and Fed Chair Powell's appearance.
Gold reaches to all-time highs near $2,230, US PCE eyed
Gold price appreciates to all-time highs near $2,230 per troy ounce, attempting to continue its winning streak for the fifth successive session on Friday. However, trading volumes are light as market participants are likely observing Good Friday.
Jito price could hit $6 as JTO coils up inside this bullish pattern
Jito (JTO) price has been on an uptrend since forming a local bottom in early January. Since then, JTO has revisited the key swing point formed in early December, suggesting the bulls’ intention to move higher.
Key events in developed markets next week
Next week, the main focus will be inflation and the labour market in the Eurozone. We expect services inflation to be impacted by the easter effect, while the unemployment rate to be unchanged.