US Dollar Index: Reclaims 200-day EMA, surpasses 2017 yearly high, as bulls stepped in eyeing 104.000


  • The US Dollar Index (DXY) gains 0.36%, trading at 103.888, maintaining a rally for three days and surpassing the 200-day EMA.
  • DXY must hit 105.883 YTD high to confirm the double-bottom pattern, surpassing multiple resistances.
  • Potential risks lie beneath the 200-day EMA; breaking it may lead DXY toward 100-day EMA at 103.212 and May 22's 102.964 low.

The US Dollar Index (DXY), which measures a basket of six currencies against the US Dollar (USD), rallies for three straight days, reclaims the 200-day Exponential Moving Average (EMA) at 103.743 and is also exchanging hands above the 2017 yearly high of 103.820. At the time of writing, the DXY is trading hands at 103.888, gaining 0.36%, with bulls eyeing the 104.000 mark.

US Dollar Index Price Analysis: Technical outlook

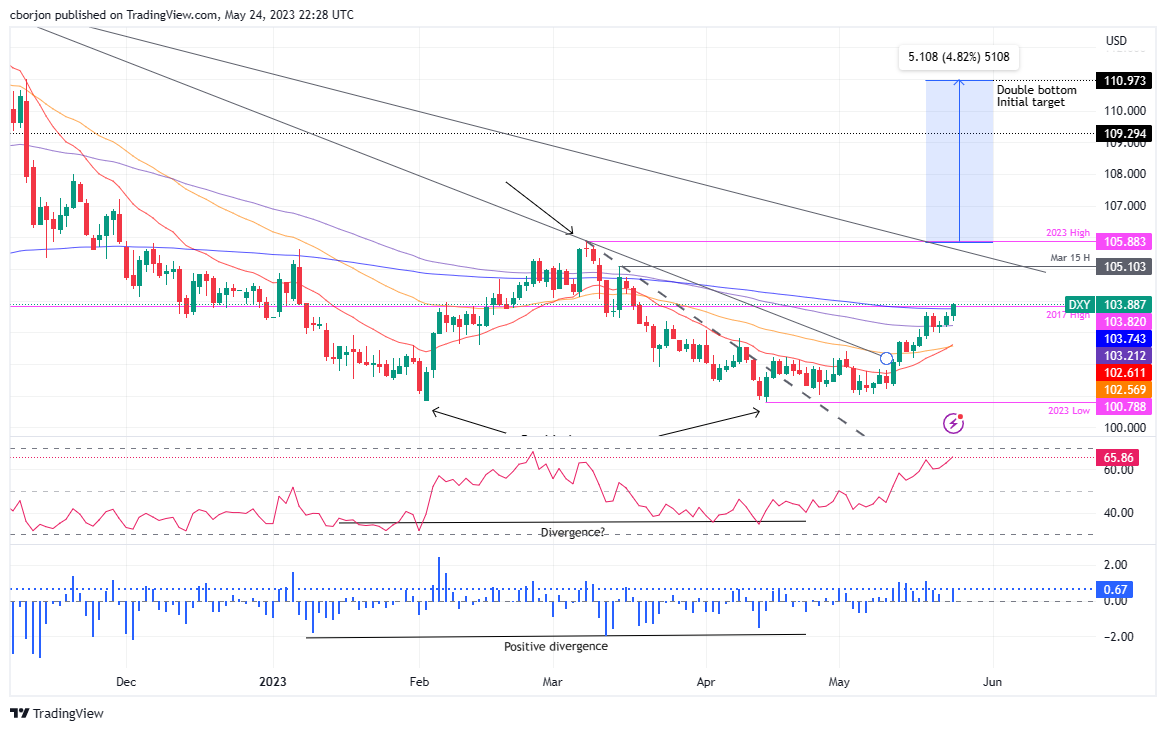
From a daily chart perspective, the US Dollar Index is neutral to bullish biased, but it could cement its bias as bullish once the DXY achieves a decisive break above the 200-day EMA. It should be said that the double-bottom that emerged in the weekly chart, as I wrote in a news article on April 14, US Dollar Index: Could a double bottom at the weekly chart drive the DXY to 111.000? remains in play.

However, to validate the double-bottom chart pattern, the DXY must get to the year-to-date (YTD) high of 105.883, though the greenback needs to hurdle some resistance levels on its way up. Meanwhile, the Relative Strength Index (RSI) indicator is in bullish territory, with some room before hitting overbought levels, while the 3-day Rate of Change (RoC) suggests that buyers are gathering momentum.

If the DXY reclaims 104.000, the next resistance level to test would be the March 15 daily high of 105.103. Break above, and the DXY will have a clear run toward testing an eight-month-old resistance trendline around the 105.300-600 area, ahead of piercing the YTD high at 105.883

Downside risks for the DXY remain below the 200-day EMA, which could send the greenback sliding towards the 100-day EMA at 103.212. A clear break will send the DXY toward the May 22 swing low of 102.964, slightly below the 103.000 mark.

US Dollar Index Price Action – Daily chart

US Dollar Index: Daily chart

Dollar Index Spot

Overview
Today last price 103.91
Today Daily Change 0.38
Today Daily Change % 0.37
Today daily open 103.53
 
Trends
Daily SMA20 102.17
Daily SMA50 102.3
Daily SMA100 102.87
Daily SMA200 105.66
 
Levels
Previous Daily High 103.65
Previous Daily Low 103.16
Previous Weekly High 103.63
Previous Weekly Low 102.2
Previous Monthly High 103.06
Previous Monthly Low 100.79
Daily Fibonacci 38.2% 103.46
Daily Fibonacci 61.8% 103.35
Daily Pivot Point S1 103.25
Daily Pivot Point S2 102.96
Daily Pivot Point S3 102.76
Daily Pivot Point R1 103.73
Daily Pivot Point R2 103.93
Daily Pivot Point R3 104.22


Share: Feed news

Information on these pages contains forward-looking statements that involve risks and uncertainties. Markets and instruments profiled on this page are for informational purposes only and should not in any way come across as a recommendation to buy or sell in these assets. You should do your own thorough research before making any investment decisions. FXStreet does not in any way guarantee that this information is free from mistakes, errors, or material misstatements. It also does not guarantee that this information is of a timely nature. Investing in Open Markets involves a great deal of risk, including the loss of all or a portion of your investment, as well as emotional distress. All risks, losses and costs associated with investing, including total loss of principal, are your responsibility. The views and opinions expressed in this article are those of the authors and do not necessarily reflect the official policy or position of FXStreet nor its advertisers. The author will not be held responsible for information that is found at the end of links posted on this page.

If not otherwise explicitly mentioned in the body of the article, at the time of writing, the author has no position in any stock mentioned in this article and no business relationship with any company mentioned. The author has not received compensation for writing this article, other than from FXStreet.

FXStreet and the author do not provide personalized recommendations. The author makes no representations as to the accuracy, completeness, or suitability of this information. FXStreet and the author will not be liable for any errors, omissions or any losses, injuries or damages arising from this information and its display or use. Errors and omissions excepted.

The author and FXStreet are not registered investment advisors and nothing in this article is intended to be investment advice.

Recommended content


Recommended content

Editors’ Picks

EUR/USD stays in positive territory above 1.0850 after US data

EUR/USD stays in positive territory above 1.0850 after US data

EUR/USD clings to modest daily gains above 1.0850 in the second half of the day on Friday. The improving risk mood makes it difficult for the US Dollar to hold its ground after PCE inflation data, helping the pair edge higher ahead of the weekend.

EUR/USD News

GBP/USD stabilizes above 1.2850 as risk mood improves

GBP/USD stabilizes above 1.2850 as risk mood improves

GBP/USD maintains recovery momentum and fluctuates above 1.2850 in the American session on Friday. The positive shift seen in risk mood doesn't allow the US Dollar to preserve its strength and supports the pair.

GBP/USD News

Gold rebounds above $2,380 as US yields stretch lower

Gold rebounds above $2,380 as US yields stretch lower

Following a quiet European session, Gold gathers bullish momentum and trades decisively higher on the day above $2,380. The benchmark 10-year US Treasury bond yield loses more than 1% on the day after US PCE inflation data, fuelling XAU/USD's upside.

Gold News

Avalanche price sets for a rally following retest of key support level

Avalanche price sets for a rally following retest of  key support level

Avalanche (AVAX) price bounced off the $26.34 support level to trade at $27.95 as of Friday. Growing on-chain development activity indicates a potential bullish move in the coming days.

Read more

The election, Trump's Dollar policy, and the future of the Yen

The election, Trump's Dollar policy, and the future of the Yen

After an assassination attempt on former President Donald Trump and drop out of President Biden, Kamala Harris has been endorsed as the Democratic candidate to compete against Trump in the upcoming November US presidential election.

Read more

Forex MAJORS

Cryptocurrencies

Signatures