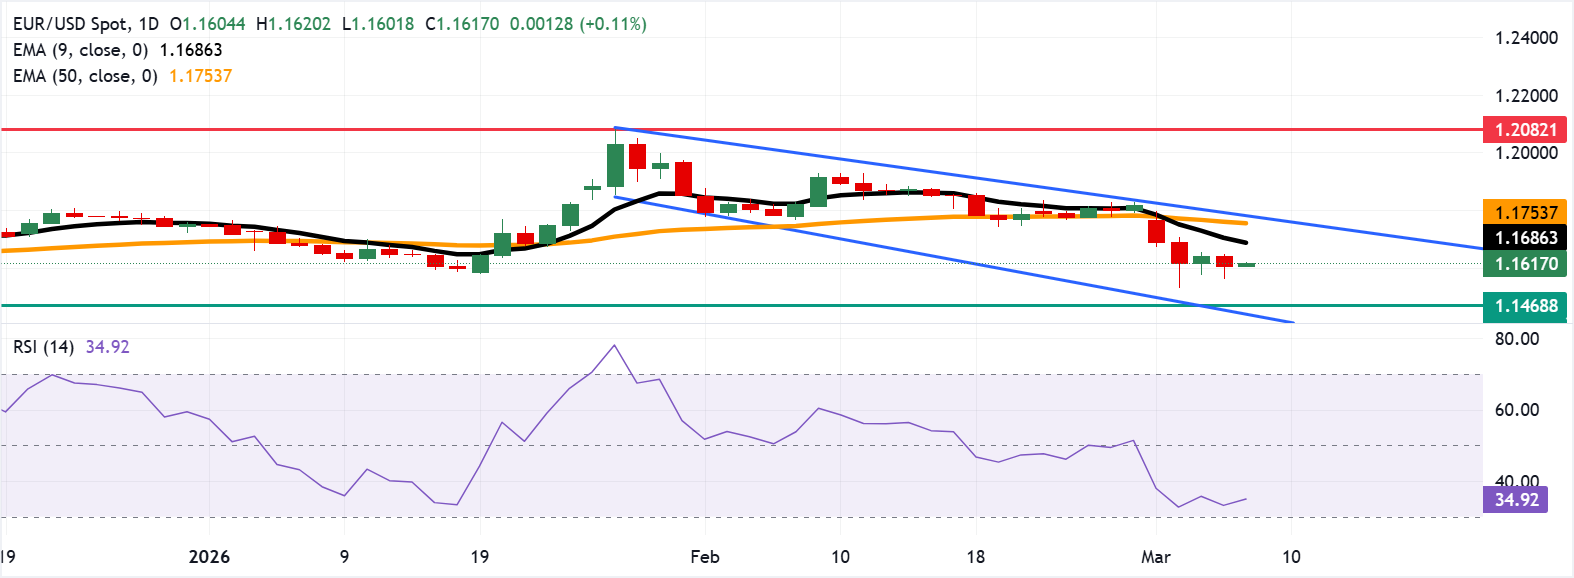
EUR/USD Price Forecast: Eyes nine-day EMA barrier after rebounding from 1.1600
- EUR/USD may navigate the region around the seven-month low of 1.1468.
- The 14-day Relative Strength Index near 35 signals sustained bearish pressure.
- The initial resistance lies at the nine-day EMA of 1.1686.

EUR/USD gains ground after registering modest losses in the previous session, trading around 1.1620 during the Asian hours on Friday. The technical analysis of the daily chart suggests an ongoing bearish bias as the pair remains within the descending channel pattern.
The near-term bias is mildly bearish as spot holds below the short-term nine-day Exponential Moving Average (EMA) and presses under the flattening 50-day group.
The momentum indicator 14-day Relative Strength Index (RSI) around 35 stays below the 50 midline, indicating persistent bearish pressure rather than oversold capitulation, which keeps the focus on further downside as long as price remains capped beneath the short-term averages.
On the downside, the EUR/USD pair may navigate the region around the seven-month low of 1.1468, followed by the lower boundary of the descending channel around 1.1440.
The EUR/USD may target the initial resistance at the nine-day EMA of 1.1686, followed by the 50-day EMA at 1.1753 and the upper descending channel boundary around 1.1790.
Further advances above the descending channel would cause the emergence of the bullish bias and support the EUR/USD pair to explore the area around 1.2082, the highest level since June 2021.
(The technical analysis of this story was written with the help of an AI tool.)
Euro Price Today
The table below shows the percentage change of Euro (EUR) against listed major currencies today. Euro was the strongest against the US Dollar.
| USD | EUR | GBP | JPY | CAD | AUD | NZD | CHF | |
|---|---|---|---|---|---|---|---|---|
| USD | -0.10% | -0.08% | -0.03% | -0.09% | -0.35% | -0.19% | -0.07% | |
| EUR | 0.10% | 0.02% | 0.09% | -0.01% | -0.25% | -0.09% | 0.03% | |
| GBP | 0.08% | -0.02% | 0.06% | -0.03% | -0.27% | -0.11% | 0.00% | |
| JPY | 0.03% | -0.09% | -0.06% | -0.08% | -0.33% | -0.18% | -0.05% | |
| CAD | 0.09% | 0.00% | 0.03% | 0.08% | -0.25% | -0.09% | 0.03% | |
| AUD | 0.35% | 0.25% | 0.27% | 0.33% | 0.25% | 0.16% | 0.27% | |
| NZD | 0.19% | 0.09% | 0.11% | 0.18% | 0.09% | -0.16% | 0.12% | |
| CHF | 0.07% | -0.03% | -0.01% | 0.05% | -0.03% | -0.27% | -0.12% |
The heat map shows percentage changes of major currencies against each other. The base currency is picked from the left column, while the quote currency is picked from the top row. For example, if you pick the Euro from the left column and move along the horizontal line to the US Dollar, the percentage change displayed in the box will represent EUR (base)/USD (quote).
Author

Akhtar Faruqui
FXStreet
Akhtar Faruqui is a Forex Analyst based in New Delhi, India. With a keen eye for market trends and a passion for dissecting complex financial dynamics, he is dedicated to delivering accurate and insightful Forex news and analysis.


