US Dollar Index rebounds toward 99.50 as trade tensions ease, but bearish pressure lingers
- The DXY Index is trading near 99.50, up around 0.75% on the day.
- President Trump’s decision to delay 50% tariffs on EU imports lifts near-term sentiment.
- Bulls need a sustained daily close above 100.50 to negate the bearish outlook.

The US Dollar Index (DXY), which tracks the value of the US Dollar (USD), is pushing upward as market participants respond to fading trade tensions. Markets are drawing fresh optimism from President Trump's decision to delay the implementation of 50% tariffs on EU imports.
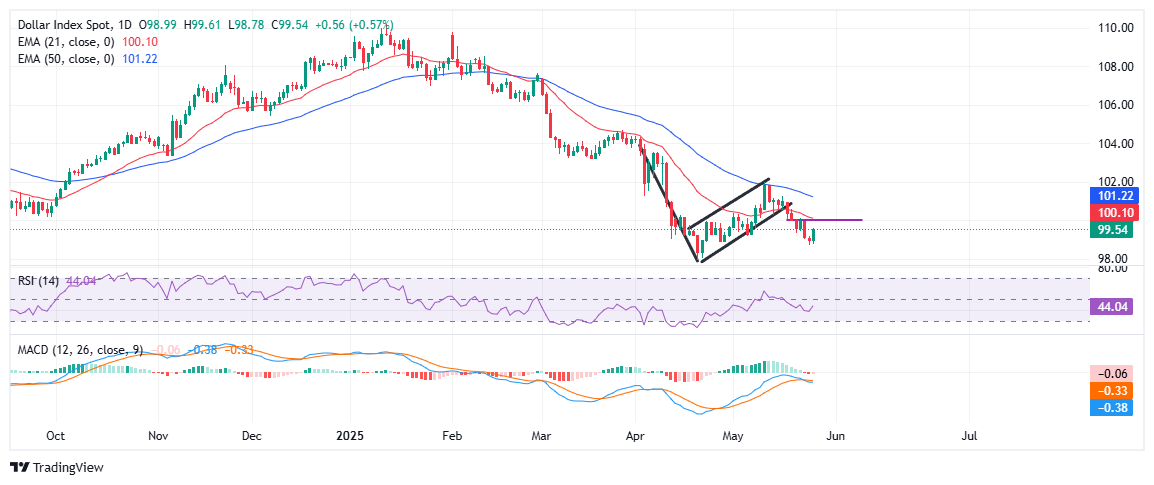
At the time of writing, the DXY index is staging a modest rebound from the four-week low touched on Monday. The Index is seen trading around 99.50 during the American session, up nearly 0.75% on the day, paring some of the losses from the previous week. While the short-term bounce has given some relief to US Dollar bulls, the broad technical structure continues to favor the downside, with momentum indicators still struggling to turn bullish.
Zooming in on the daily chart, the DXY decisively broke below the bearish flag pattern last week. The breakdown occurred around the 100.50 area, which had previously provided short-term structural support but now flipped into a key resistance zone.
However, the Index is attempting to recover off a near-term support level around the 99.00 round figure. This area, which also includes the recent swing low near 98.80, is offering a cushion for now as buyers cautiously step back in.
That said, the rebound is approaching stiff resistance near the 21-day Exponential Moving Average (EMA) at 100.10, and the previously broken flag base at 100.50 is now acting as a ceiling. The price remains below short-term moving averages with both the 21-day and 50-day EMAs (101.22) sloping downward.
From a structural standpoint, any upside is likely to face headwinds unless the index can convincingly break above these moving averages. On the upside, a decisive break above the 100.00 psychological zone will be the first target for bulls. Until then, the path of least resistance appears tilted to the downside with rallies likely to be viewed as selling opportunities. Meanwhile, a break below the 98.80 floor would likely pave the way for a deeper correction toward the 97.50 region.
Looking at the momentum indicators, the Relative Strength Index (RSI) is picking up slightly after last week’s slide but remains below the 50 mark, indicating that buyers haven’t yet taken control. Similarly, the Moving Average Convergence Divergence (MACD) indicator remains in negative territory, with the signal line showing no signs of a bullish crossover. The lack of conviction in both indicators suggests that the market remains tilted in favor of sellers despite the current bounce.
Author

Vishal Chaturvedi
FXStreet
I am a macro-focused research analyst with over four years of experience covering forex and commodities market. I enjoy breaking down complex economic trends and turning them into clear, actionable insights that help traders stay ahead of the curve.