US Dollar Index Price Forecast: Remains above 103.00 with expecting a trend reversal
- The US Dollar Index may reverse its trend if it moves toward the narrower part of the descending wedge.
- The momentum indicator MACD suggests a bearish trend for the US Dollar.
- The nine-day EMA at 103.39 level could act as an immediate barrier.

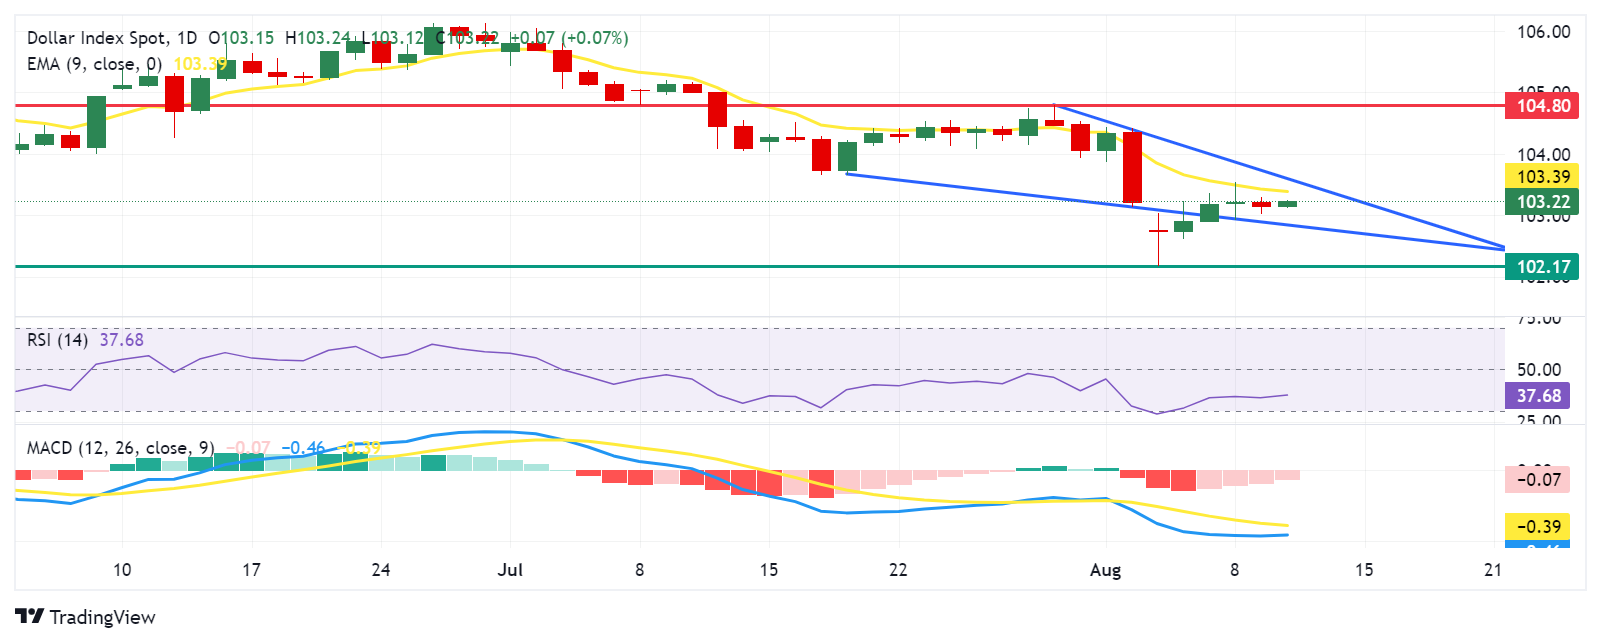
The US Dollar Index (DXY) retraces its recent losses from the previous session, trading around 103.20 during the European hours on Monday. The daily chart analysis shows the pair is consolidating within a descending wedge, indicating a bearish bias. A move toward the narrower part of the descending wedge could suggest a potential trend reversal.
The Moving Average Convergence Divergence (MACD) indicator points to bearish momentum, with the MACD line below both the signal line and the centerline. A convergence of the MACD line below the signal line would suggest a potential weakening of the bearish momentum for the US Dollar Index.
Additionally, the 14-day Relative Strength Index (RSI) consolidates above the 30 level, hinting at a possible upcoming correction. A further rise toward the 50 level would suggest a weakening of the bearish outlook.
On the downside, US Dollar (USD) may test key support at the lower edge of the descending wedge around the level of 102.90. A break below this level could increase downward pressure, potentially guiding the US Dollar Index to retest a six-month low at 102.17, recorded on August 5.
For resistance, the DXY may face an immediate barrier around the nine-day Exponential Moving Average (EMA) at 103.39 level, followed by the upper boundary of the descending wedge around 103.60 level. A breakout above this level could propel the index to retest a six-week high at 104.80, marked on July 30.
US Dollar Index: Daily Chart
US Dollar PRICE Today
The table below shows the percentage change of US Dollar (USD) against listed major currencies today. US Dollar was the strongest against the Japanese Yen.
| USD | EUR | GBP | JPY | CAD | AUD | NZD | CHF | |
|---|---|---|---|---|---|---|---|---|
| USD | -0.06% | 0.07% | 0.44% | -0.06% | -0.33% | -0.43% | 0.42% | |
| EUR | 0.06% | 0.15% | 0.47% | -0.01% | -0.40% | -0.38% | 0.49% | |
| GBP | -0.07% | -0.15% | 0.58% | -0.15% | -0.55% | -0.53% | 0.31% | |
| JPY | -0.44% | -0.47% | -0.58% | -0.48% | -0.83% | -0.86% | -0.07% | |
| CAD | 0.06% | 0.01% | 0.15% | 0.48% | -0.33% | -0.37% | 0.47% | |
| AUD | 0.33% | 0.40% | 0.55% | 0.83% | 0.33% | 0.02% | 0.86% | |
| NZD | 0.43% | 0.38% | 0.53% | 0.86% | 0.37% | -0.02% | 0.84% | |
| CHF | -0.42% | -0.49% | -0.31% | 0.07% | -0.47% | -0.86% | -0.84% |
The heat map shows percentage changes of major currencies against each other. The base currency is picked from the left column, while the quote currency is picked from the top row. For example, if you pick the US Dollar from the left column and move along the horizontal line to the Japanese Yen, the percentage change displayed in the box will represent USD (base)/JPY (quote).
Author

Akhtar Faruqui
FXStreet
Akhtar Faruqui is a Forex Analyst based in New Delhi, India. With a keen eye for market trends and a passion for dissecting complex financial dynamics, he is dedicated to delivering accurate and insightful Forex news and analysis.


