US Dollar Index Price Analysis: The leg lower could revisit 97.50
- DXY drops further and breaks below 99.00 with certain conviction.
- The decline is seen as corrective and could extend to the mid-97.00s.

DXY comes under some moderate downside pressure again and revisits the area well south of the 99.00 mark midweek.
Considering the recent price action, the corrective move in the index carries the potential to extend to the mid-97.00s, where the January highs are located (January 28). Down from here comes temporary support at the 20-day SMA, today at 96.91.
In light of the recent price action, further gains remain likely for the time being. That said, the next hurdle aligns at the 99.97 level (May 25 2020 high) closely followed by the psychological 100.00 mark. However, the continuation of the leg lower should not be ruled out following the current overbought condition of the index.
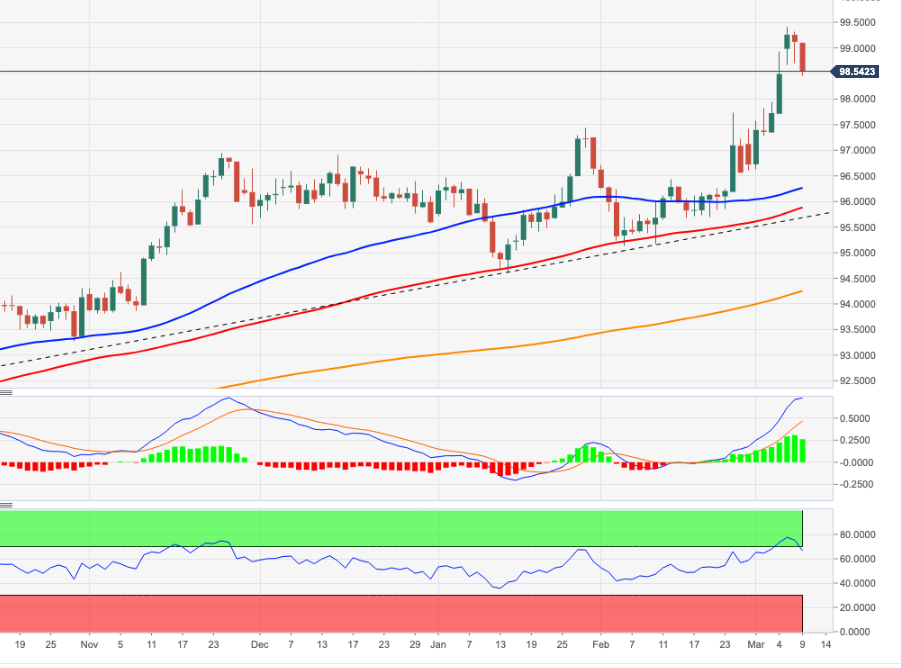
The current bullish stance in the index remains supported by the 5-month line, today near 95.70, while the longer-term outlook for the dollar is seen constructive while above the 200-day SMA at 94.22.
DXY daily chart
Author

Pablo Piovano
FXStreet
Born and bred in Argentina, Pablo has been carrying on with his passion for FX markets and trading since his first college years.


