|
US Dollar Index Price Analysis: The 6-month resistance line caps the upside
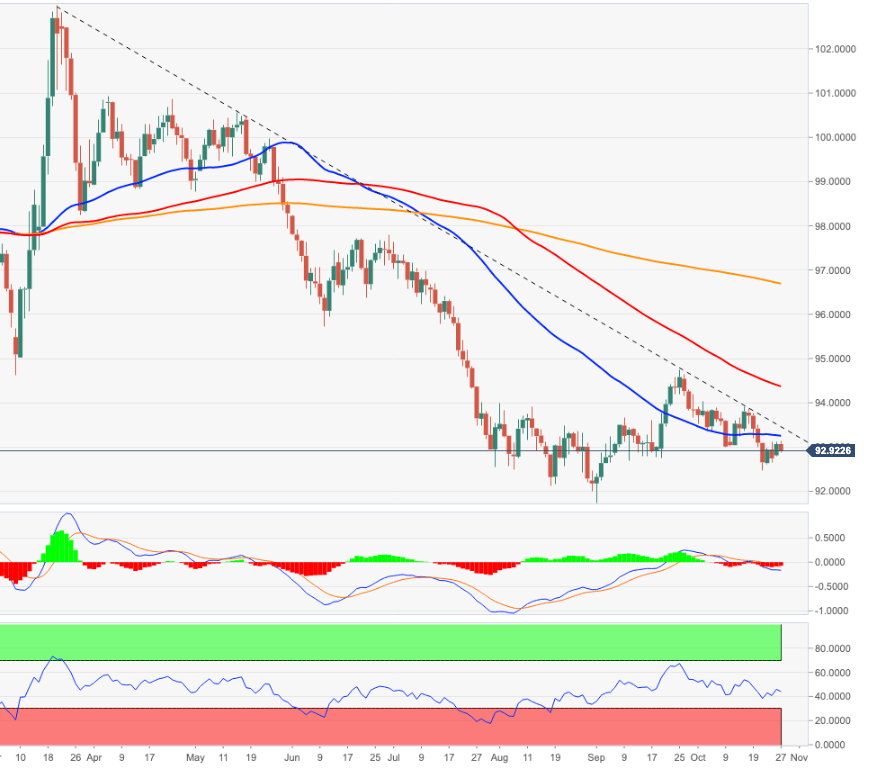
- DXY fades Monday’s uptick and recedes below the 93.00 level.
- The 93.30 zone offers interim resistance in the near-term.

DXY resumes the downside following Monday’s positive price action and comes under renewed selling pressure after a failed sustainable move beyond 93.00.
In the meantime, it seems occasional bullish attempts remain capped by the 93.30 region, where converge the 55-day SMA and the 6-month resistance line. A surpass of this area should open the door to a visit to last week’s tops around 93.90 (October 15).
While below the 200-day SMA, today at 96.68, the negative view on the dollar is expected to persist.
DXY daily chart
Author

Pablo Piovano
FXStreet
Born and bred in Argentina, Pablo has been carrying on with his passion for FX markets and trading since his first college years.
More from Pablo Piovano


