|

US Dollar Index Price Analysis: Inverted head-and-shoulders set to lift the greenback

  • The inverse head-and-shoulders pattern can lead to more upside. 
  • Upside targets can be located near 97.85 and 98.20 levels.
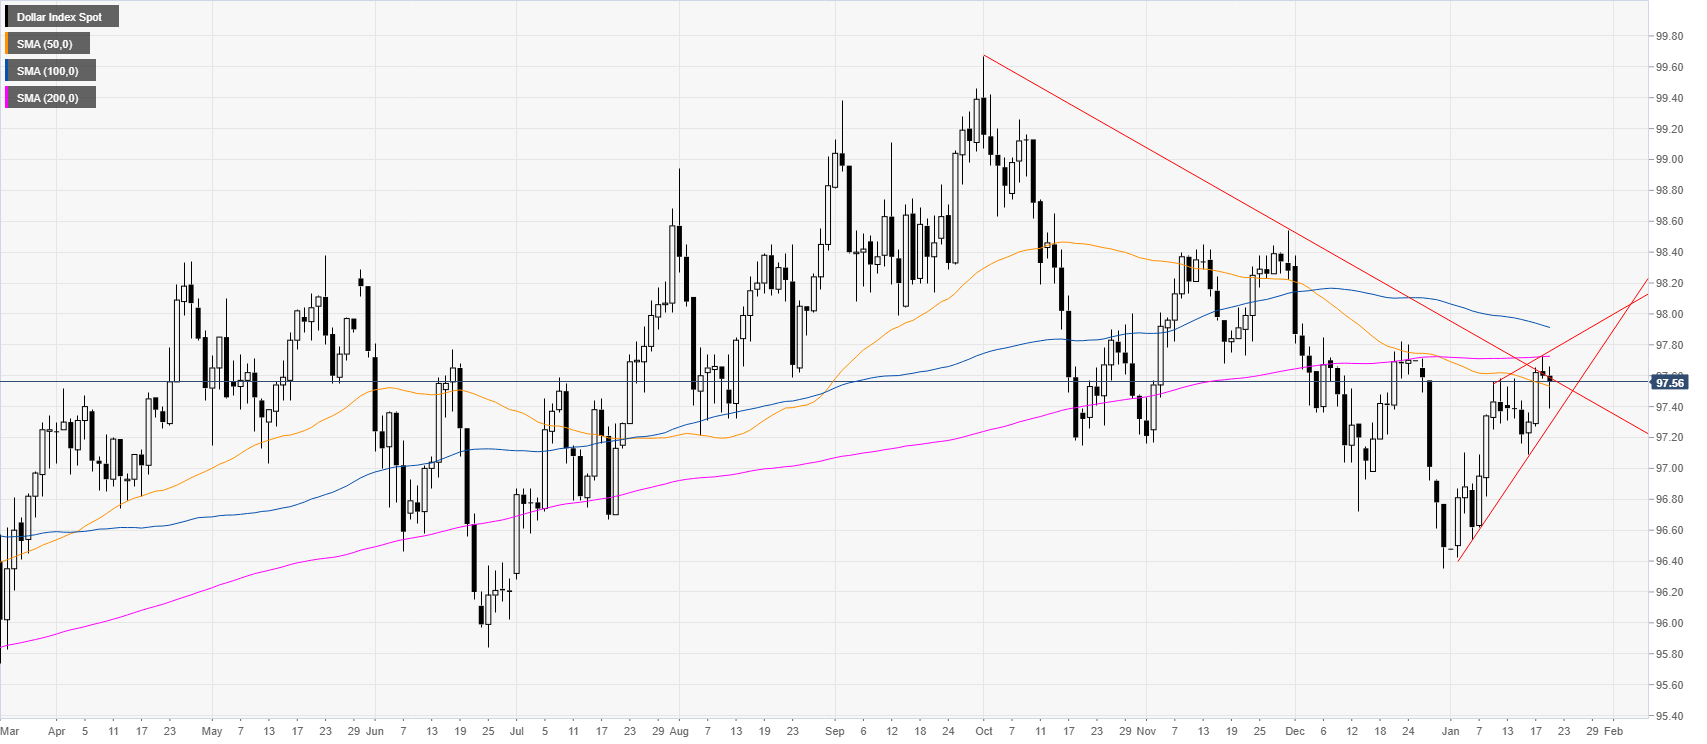
 

DXY daily chart

 
The US Dollar Index (DXY) is trading between the 50 and 200-day simple moving average (SMA). DXY is also trading within a rising wedge channel.
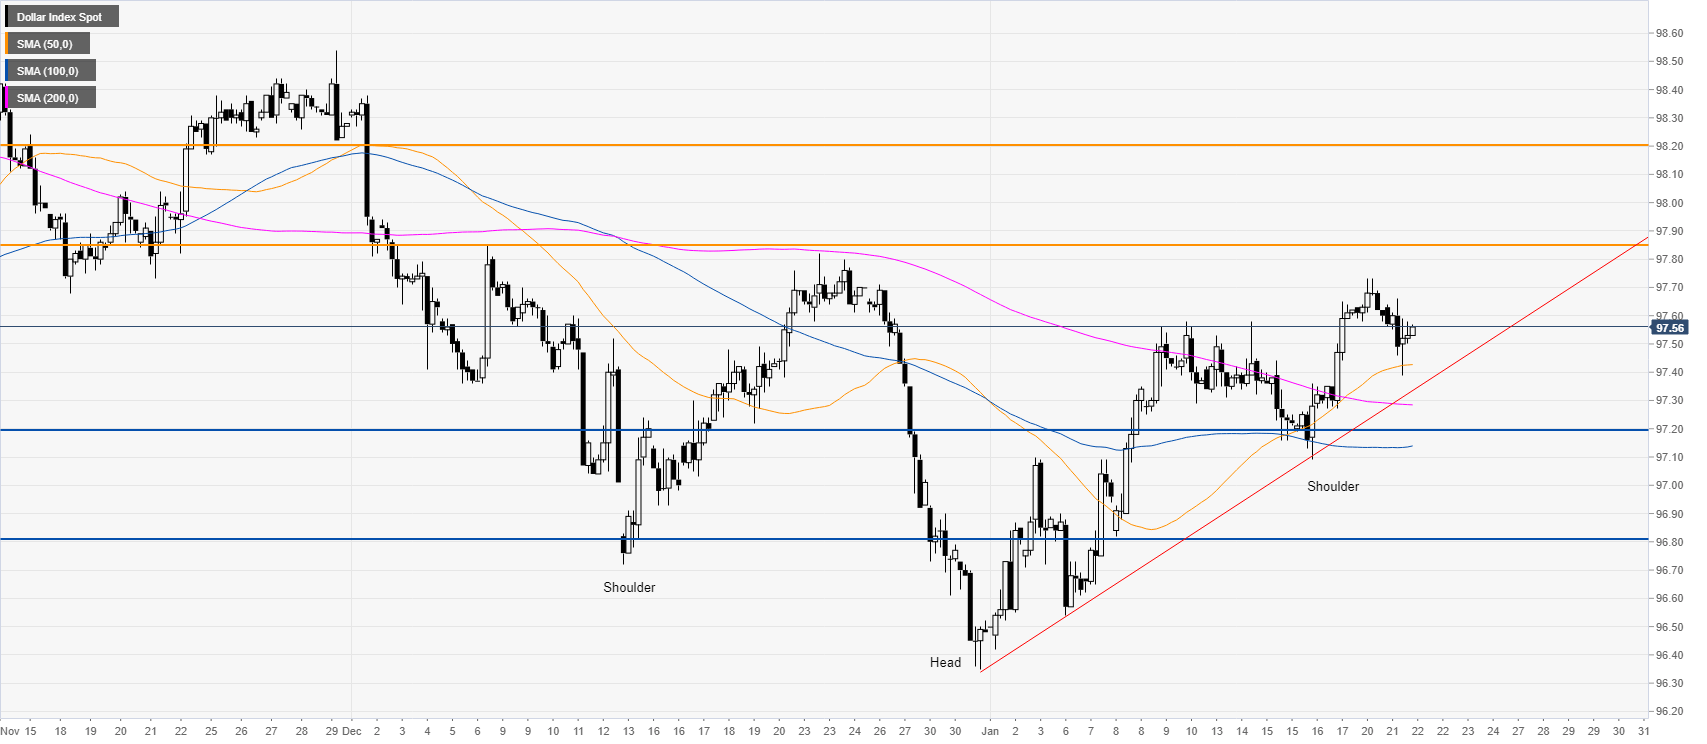


DXY four-hour chart

 
DXY is trading above the main simple moving averages (SMAs) and a rising trendline, suggesting a bullish bias in the medium term. The greenback is also in an inverted head-and-shoulder pattern and the market could stay bullish while above the right shoulder and the 97.20/10 support zone. If buyers decide to lift the market they could reach the 97.85 and 98.20 to the upside. 
 

Additional key levels 

Dollar Index Spot

Overview
Today last price97.56
Today Daily Change-0.04
Today Daily Change %-0.04
Today daily open97.6
 
Trends
Daily SMA2097.18
Daily SMA5097.55
Daily SMA10097.93
Daily SMA20097.72
 
Levels
Previous Daily High97.73
Previous Daily Low97.58
Previous Weekly High97.65
Previous Weekly Low97.09
Previous Monthly High98.38
Previous Monthly Low96.35
Daily Fibonacci 38.2%97.64
Daily Fibonacci 61.8%97.67
Daily Pivot Point S197.54
Daily Pivot Point S297.49
Daily Pivot Point S397.39
Daily Pivot Point R197.69
Daily Pivot Point R297.79
Daily Pivot Point R397.84

Author

Flavio Tosti

Flavio Tosti

Independent Analyst


More from Flavio Tosti
Share:

Editor's Picks

EUR/USD slumps below 1.1750 as USD benefits from risk-aversion

EUR/USD comes under renewed bearish pressure in the European session and trades below 1.1750 following a recovery attempt earlier in the day. The US Dollar gathers strength and weighs on the pair as investors seek refuge in the wake of Israel and the United States' joint attack on Iran.

GBP/USD targets 1.3500 barrier near moving averages

GBP/USD rebounds from the daily losses, trading around 1.3450 during the Asian hours on Monday. The technical analysis of the daily chart indicates an ongoing bearish bias, as the pair trades within a descending channel pattern.

Gold surges on safe-haven demand, rises above $5,400

Gold benefits from intense risk-aversion on Monday and climbs above $5,400, setting a fresh monthly-high in the process. Tensions in the Middle East remain high as Israel and Hezbollah continue to exchange strikes following the US-Israel joint attack on Iran over the weekend.

Bitcoin, Ethereum and Ripple under pressure as key supports face breakdown risk

Bitcoin, Ethereum, and Ripple prices trade on the back foot at the start of this week on Monday, after extending losses in the previous week. BTC is on the brink of a breakdown, ETH is capped below key resistance, and XRP risks a crack of the trendline.

The market is paying for insurance, not apocalypse

As expected, this morning felt less like a Monday market open and more like a fire drill. Futures screens flickered red. S&P contracts down almost 1%. Nasdaq off 1.2%. Brent leaped 13% through $80. Gold rose 1.6% toward $5350 before paring some gains. The dollar is strutting mildly. The Swiss franc is quietly doing what it always does in a storm, catching some safe-haven flows.

Pi Network Price Forecast: Core team offloads supply, weighing on PI recovery

Pi Network  hovers below $0.1700, broadly steady at press time on Monday, attempting a recovery after a 2% loss the previous day. Sunday’s decline aligned with nearly 49 million PI tokens offloaded by the Pi Foundation, implying a spike in supply pressure that capped the prevailing four-day recovery.