|

US Dollar Index Price Analysis: DXY stays on the way to 98.55 resistance confluence

  • DXY retreat from intraday high, holds onto Friday’s rebound from one-week low.
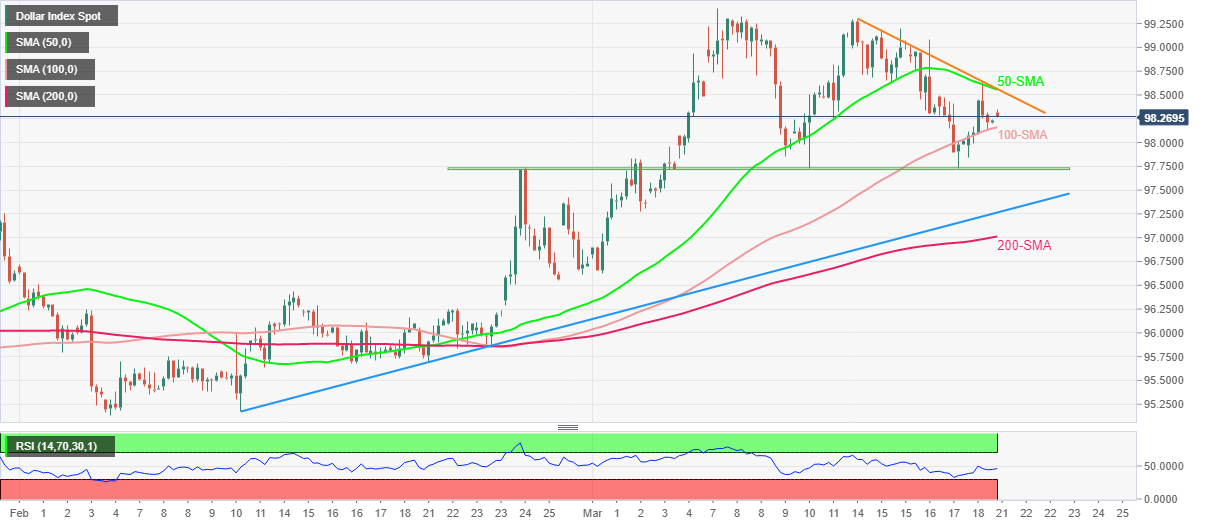
  • Sustained trading above 100-SMA, monthly horizontal support keep buyers hopeful amid steady RSI.
  • 50-SMA, weekly resistance line challenge short-term upside momentum.

US Dollar Index (DXY) pares intraday gains around 98.30 during Monday’s Asian session. However, the greenback gauge keeps the last week’s U-turn from one-month-old horizontal support and the 100-SMA.

Given the steady RSI supporting the latest rebound from the aforementioned key supports, DXY is likely to remain firmer.

That said, a convergence of the 50-SMA and a descending trend line from March 14, near 98.55, becomes the key short-term hurdle for the US Dollar Index bulls to cross.

Following that, the 99.00 threshold will act as an intermediate halt during an upward trajectory towards the monthly peak of 99.41.

Meanwhile, the 100-SMA and a horizontal support area from late February, respectively around 98.15 and 97.70, act as tough nuts to crack for the DXY bears.

In a case where the quote drops below 97.70, the odds of its further fall towards an upward sloping trend line from February 10, near 97.25, can’t be ruled out. Though, the 200-SMA level of 97.00 can defend the bulls afterward.

DXY: Four-hour chart

Trend: Further upside expected

Additional important levels

Overview
Today last price98.3
Today Daily Change0.07
Today Daily Change %0.07%
Today daily open98.23
 
Trends
Daily SMA2097.82
Daily SMA5096.64
Daily SMA10096.22
Daily SMA20094.55
 
Levels
Previous Daily High98.63
Previous Daily Low97.84
Previous Weekly High99.29
Previous Weekly Low97.73
Previous Monthly High97.74
Previous Monthly Low95.14
Daily Fibonacci 38.2%98.33
Daily Fibonacci 61.8%98.14
Daily Pivot Point S197.84
Daily Pivot Point S297.44
Daily Pivot Point S397.05
Daily Pivot Point R198.62
Daily Pivot Point R299.02
Daily Pivot Point R399.41

Author

Anil Panchal

Anil Panchal

FXStreet

Anil Panchal has nearly 15 years of experience in tracking financial markets. With a keen interest in macroeconomics, Anil aptly tracks global news/updates and stays well-informed about the global financial moves and their implications.

More from Anil Panchal
Share:

Editor's Picks

AUD/USD falls to near 0.7100 after slipping below 50-day EMA

AUD/USD depreciates after registering minor gains in the previous day, trading around 0.7120 during the Asian hours. The technical analysis of the daily chart shows the pair consolidating sideways within a rectangle pattern, as neither bulls nor bears gain control. The AUD/USD pair is holding a slight bearish tone however as it sits beneath both the nine-day and 50-day EMAs.

160.00: USD/JPY back near intervention territory after upbeat US jobs report

US Nonfarm Payrolls beat expectations by a wide margin in May, with 172K jobs added. The US Dollar rebounds after the release, helping USD/JPY recover from its intraday lows. Warnings from Japanese authorities continue to limit upside potential near the 160.00 threshold.

Gold targets $4,300 amid stronger Dollar

Gold faces increasing selling interest and navigates the area of three-month lows near the $4,300 mark per troy ounce on Friday. The precious metal’s decline comes as traders assess the stronger-than-expected NFP, while the bid bias in the Greenback and higher US Treasury yields also collaborate with the retracement.

Cardano hits five-year low even as Hoskinson clarifies "break" isn't an exit

Cardano (ADA) price is down 10% at press time on Friday, extending losses over 30% so far this week amid Charles Hoskinson's clarification that "break" isn't an exit.

Week ahead – Fed countdown begins amid US inflation data and geopolitical risks

Fed Chair Warsh’s first meeting approaches as key US inflation data could reshape expectations. Oil prices remain elevated as US-Iran talks continue; tariffs also return to the spotlight. ECB is expected to hike; will it be a one-off move or is July live?

The US economy defies the rules: 100 days into the Oil shock and the recession signal is still missing

More than three months after the start of the Iran war and the resulting disruption to global energy markets, the US economy continues to display remarkable resilience. The conflict has triggered a sharp rise in Oil prices, reignited inflationary pressures and fueled widespread concerns about a potential economic slowdown.