US Dollar Index Price Analysis: DXY looks set to refresh multi-day top above 93.00
- US dollar index picks up bids around the highest since early November 2020.
- Sustained break of key resistance lines and 200-day SMA join bullish MACD to back DXY buyers.
- Mid-October 2020 tops can offer an intermediate halt before hitting the 94.30 key resistance.
- Bears are less likely to take risk of entry above 92.50.

US dollar index (DXY) stays firm around 93.35, up 0.07% intraday, while poking the November 2020 tops during early Tuesday. In doing so, the greenback gauge justifies its latest breakouts of key technical hurdles amid the bullish MACD.
On only the sustained run-up past-200-day SMA and a six-month-old falling trend line near 92.50 but the break of an ascending resistance line from early February, near 93.15, also favor DXY bulls to aim for mid-October 2020 peak surrounding 93.90.
However, the quote’s further upside will be tamed by the 94.00 threshold and a horizontal area around 94.30 comprising tops marked since September 29, 2020. Also acting as the key resistance is the late 2020 high of 94.74.
Meanwhile, pullback moves will have to slip below 93.15 on a daily closing basis to recall the short-term sellers. Following that the 92.50 support confluence will be in the spotlight.
If at all the US dollar index bears conquer the 92.50 crucial support, the 92.00 round-figure and March 18 low near 91.30 will regain the market’s attention.
Overall, DXY is well set for the upward trajectory towards late 2020 highs.
DXY daily chart
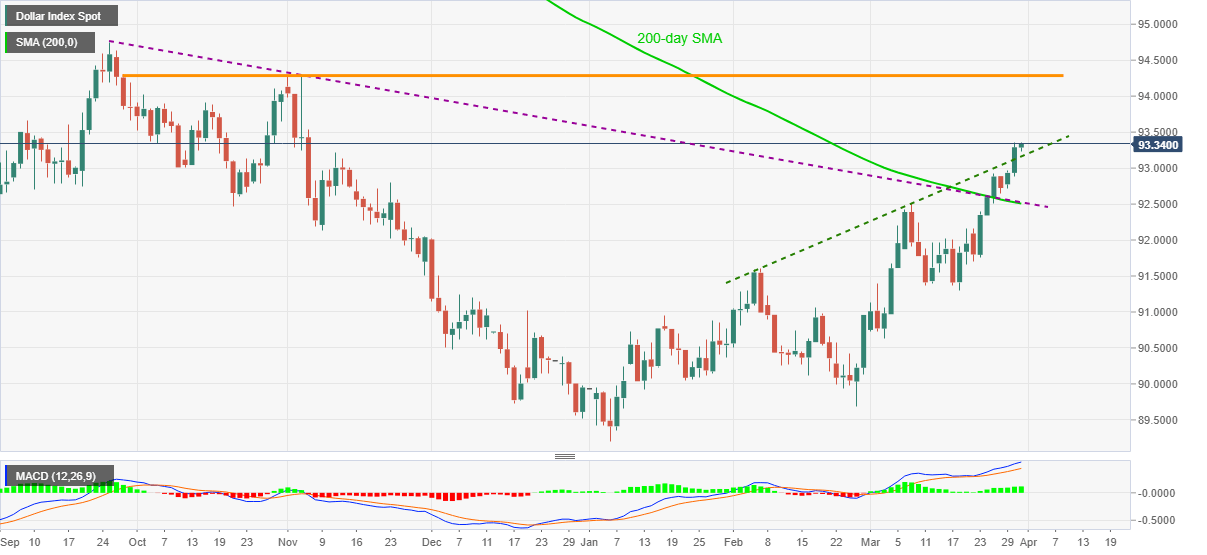
Trend: Bullish
Author

Anil Panchal
FXStreet
Anil Panchal has nearly 15 years of experience in tracking financial markets. With a keen interest in macroeconomics, Anil aptly tracks global news/updates and stays well-informed about the global financial moves and their implications.


