|

US Dollar Index Price Analysis: DXY justifies dragonfly Doji above 200-DMA to target 92.00

  • DXY consolidates the previous week’s losses, picks up bids to intraday high of late.
  • Bullish candlestick formation above the key SMA support favors buyers.
  • Late-April, early May top add to the downside filters.

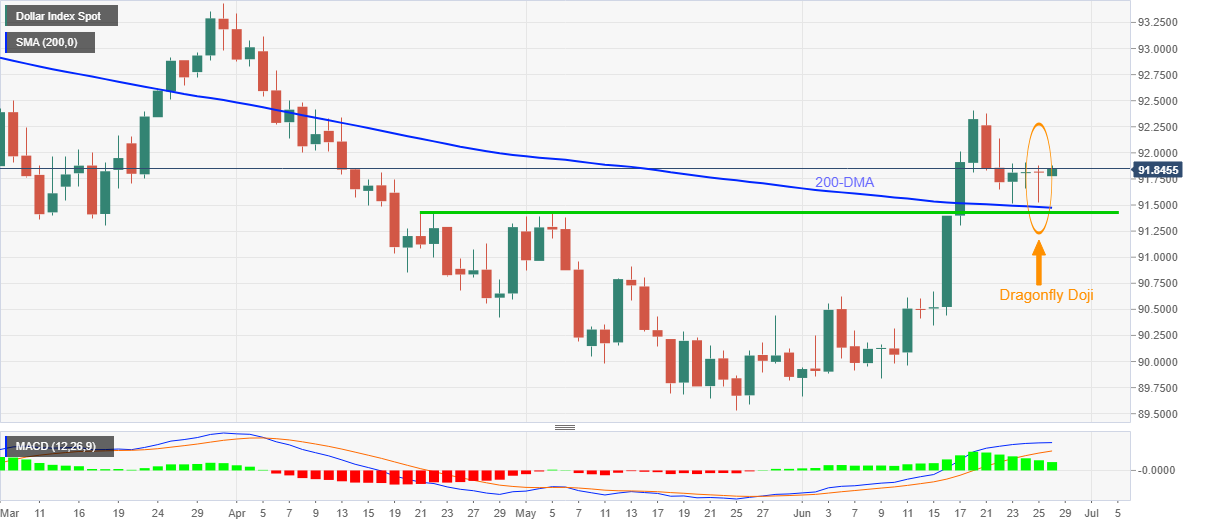
US dollar index (DXY) reverses the early Asian losses, attacks intraday top near 91.85, ahead of Monday’s European session. In doing so, the greenback gauge justifies Friday’s dragonfly Doji bullish candlestick above 200-day SMA, (DMA). Also favoring the USD optimists could be the bullish MACD.

Hence, DXY buyers are well-directed towards the 92.00 threshold before challenging the monthly top near 92.40.

However, the late March tops near 92.80 may probe the US dollar index bulls before directing them to the yearly peak of 93.43.

Alternatively, a downside break of 200-DMA, around 91.45 is a green pass to the DXY sellers are a two-month-old horizontal area around 91.40, which will validate the quote’s further downside.

On a clear break of 91.40, the mid-May top near 90.90 should return to the charts.

DXY daily chart

Trend: Recovery expected

Additional important levels

Overview
Today last price91.87
Today Daily Change0.05
Today Daily Change %0.05%
Today daily open91.82
 
Trends
Daily SMA2090.84
Daily SMA5090.66
Daily SMA10091.12
Daily SMA20091.48
 
Levels
Previous Daily High91.88
Previous Daily Low91.53
Previous Weekly High92.38
Previous Weekly Low91.51
Previous Monthly High91.44
Previous Monthly Low89.54
Daily Fibonacci 38.2%91.66
Daily Fibonacci 61.8%91.74
Daily Pivot Point S191.6
Daily Pivot Point S291.39
Daily Pivot Point S391.25
Daily Pivot Point R191.96
Daily Pivot Point R292.09
Daily Pivot Point R392.31

Author

Anil Panchal

Anil Panchal

FXStreet

Anil Panchal has nearly 15 years of experience in tracking financial markets. With a keen interest in macroeconomics, Anil aptly tracks global news/updates and stays well-informed about the global financial moves and their implications.

More from Anil Panchal
Share:

Editor's Picks

AUD/USD falls to near 0.7100 after slipping below 50-day EMA

AUD/USD depreciates after registering minor gains in the previous day, trading around 0.7120 during the Asian hours. The technical analysis of the daily chart shows the pair consolidating sideways within a rectangle pattern, as neither bulls nor bears gain control. The AUD/USD pair is holding a slight bearish tone however as it sits beneath both the nine-day and 50-day EMAs.

USD/JPY consolidates near 160.00 as US NFP takes centre stage

The USD/JPY pair trades in a tight range around 160.00 during the European trading session. The pair wobbles as investors await the United States Nonfarm Payrolls data for May, which will be published at 12:30 GMT. Investors will closely monitor the employment data to get fresh cues regarding the Federal Reserve’s monetary policy outlook.

Gold returns to the red, awaits US NFP

Gold price is looking to test the weekly lows, while in the red near $4,450 in the early European session on Friday. The precious metal remains vulnerable amid ongoing geopolitical turmoil. Traders will closely monitor the developments surrounding the US-Iran peace deal and the US May employment report later on Friday.


Arthur Hayes' “Holy Trinity” is dead: Exits Zcash after Orchard Pool exploit

Arthur Hayes has entirely dumped his “Holy Trinity” holdings by offloading his Zcash holdings on Friday. The privacy coin is down 13% so far on Friday, extending Thursday’s 26% decline after an Orchard Shielded Pool audit revealed a critical vulnerability that allowed the undetectable minting of fake coins. Hayes continues to hold Worldcoin ahead of the upcoming SpaceX Initial Public Offering, on the chance of a “high-beta proxy” rally.

Nonfarm Payrolls set to show stable labor market in May as markets digest Fed hawkish shift

The United States Bureau of Labor Statistics will release the Nonfarm Payrolls data for May on Friday at 12:30 GMT. Investors expect NFP to rise by 85K following the surprisingly strong 185K and 115K increases recorded in March and April, respectively.

The US economy defies the rules: 100 days into the Oil shock and the recession signal is still missing

More than three months after the start of the Iran war and the resulting disruption to global energy markets, the US economy continues to display remarkable resilience. The conflict has triggered a sharp rise in Oil prices, reignited inflationary pressures and fueled widespread concerns about a potential economic slowdown.