US Dollar Index Price Analysis: DXY defends 93.00 as bears flirt with monthly support
- DXY holds lower ground after the biggest daily slump in a month.
- Previous resistance from early September restricts immediate downside.
- Convergence of 200-SMA, three-week-old rising trend line becomes the key.

US Dollar Index (DXY) bears take a breather around 93.10, picks up bids of late, amid the early Friday.
The greenback gauge dropped the most since late August the previous day but couldn’t conquer the resistance-turned-support line from September 01, which in turn triggers the quote’s latest corrective pullback.
However, the recovery moves remain doubtful unless crossing a five-week-old horizontal area surrounding 93.50. Also acting as an upside filter is the yearly high close to 93.72.
Should the DXY buyers manage to cross the 93.72 resistance, the odds of witnessing a rally towards the November 2020 peak near 94.30 can’t be ruled out.
Meanwhile, a downside break of the immediate support line, near 93.00, will direct US Dollar Index towards a confluence of 200-SMA and an ascending trend line from September 03, near 92.80.
It’s worth noting that DXY’s sustained weakness past 92.80 won’t hesitate to refresh the monthly low of 91.94.
DXY: Four-hour chart
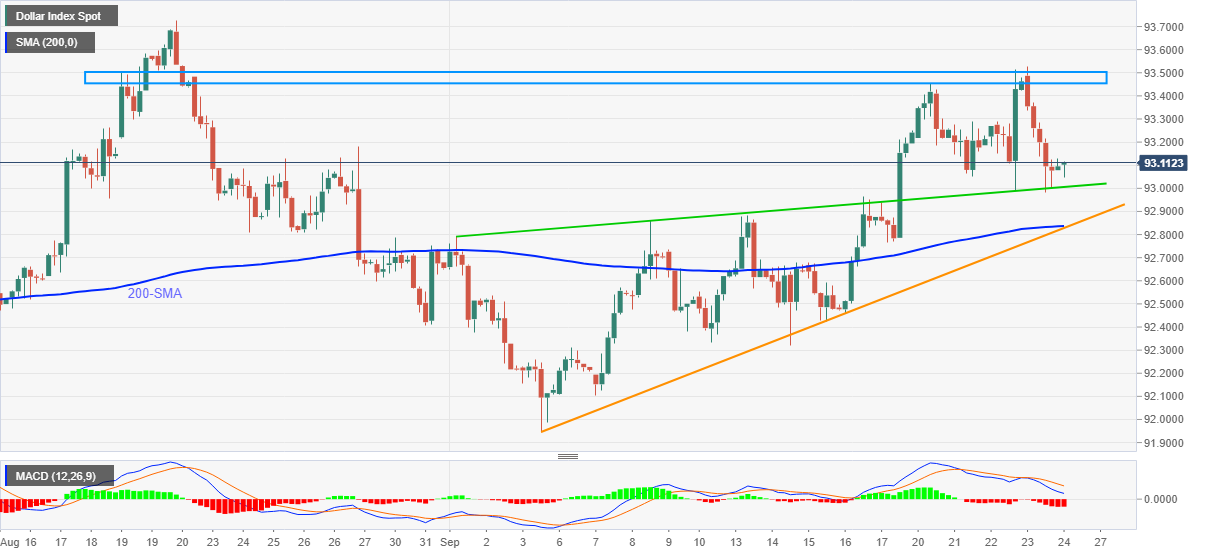
Trend: Corrective pullback expected
Author

Anil Panchal
FXStreet
Anil Panchal has nearly 15 years of experience in tracking financial markets. With a keen interest in macroeconomics, Anil aptly tracks global news/updates and stays well-informed about the global financial moves and their implications.


