|

US Dollar Index Price Analysis: Bulls move in, eyeing a close above 103.30s

  • The US Dollar Index advances for two days, forming a “morning star” candle chart pattern.
  • Oscillators paint a mixed picture, though RSI could be turning bullish.
  • A daily close above 103.26 will pave the DXY’s way to test 104.00

The US Dollar Index (DXY), which tracks a basket of six currencies against the US Dollar (USD), advances 1.58% after hitting a 7-week low of 101.91. At the time of writing, the DXY is trading at 103.12 after hitting a daily low of 102.50.

US Dollar Index Price action

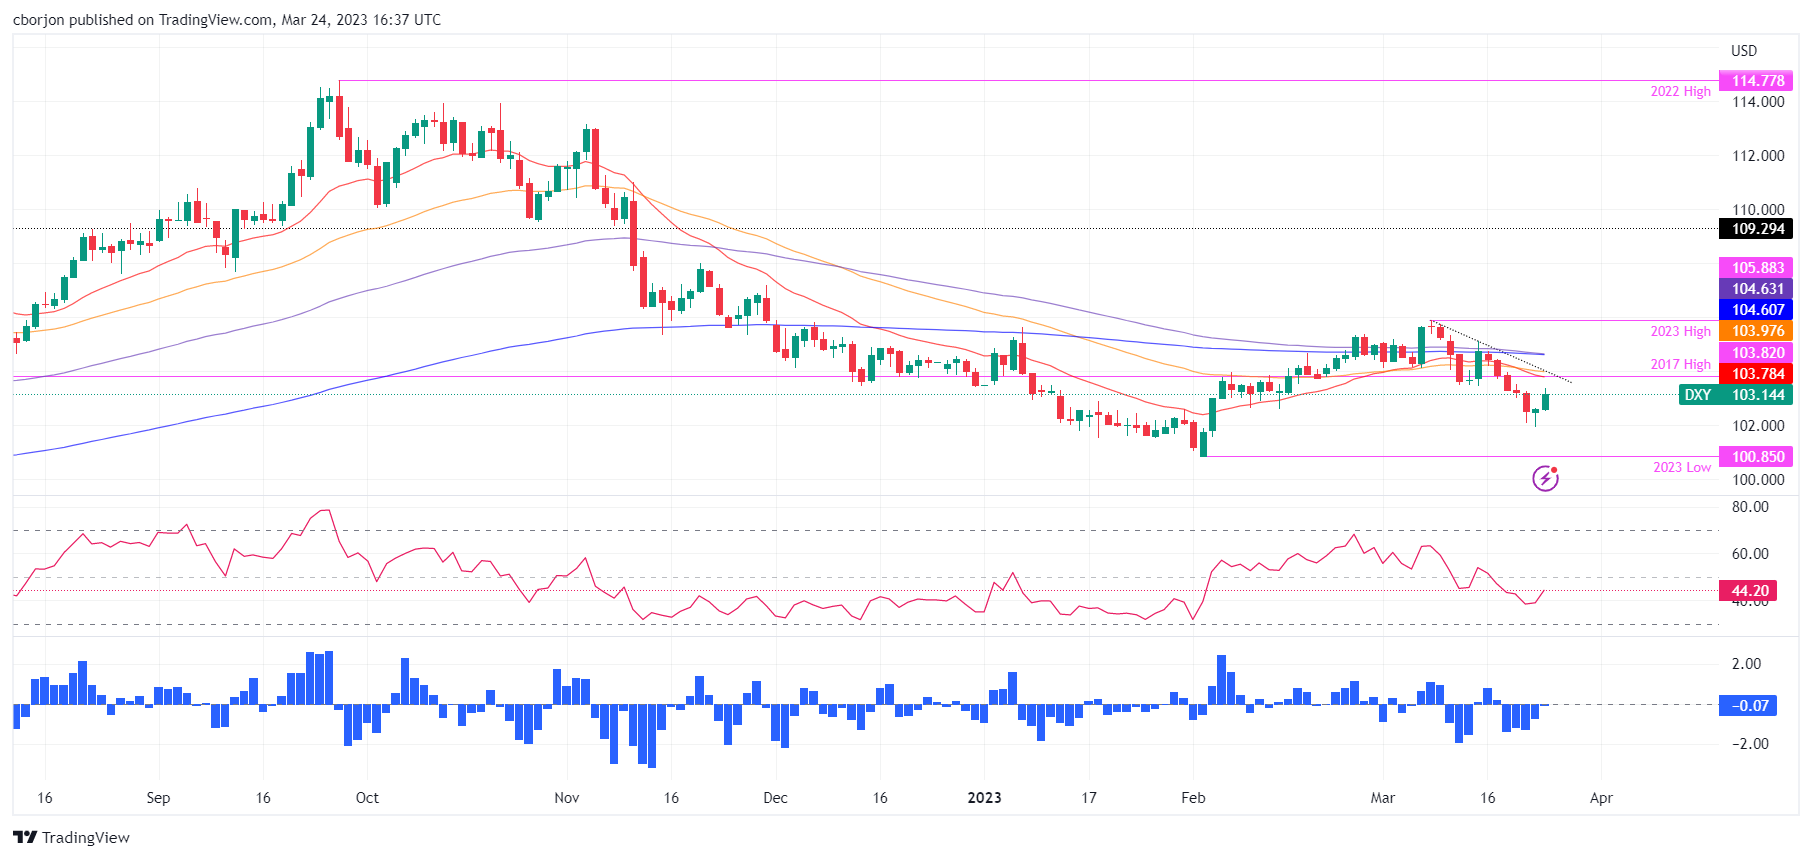
From a daily chart perspective, the DXY is neutrally biased, as it remains above the 2023 low of 100.85. In addition, the US Dollar Index pierced the last higher-high (HH) of 105.63 and printed a YTD high at 105.88. In addition, a candlestick chart pattern, “morning star,” it’s forming, which could pave the way to test the daily Exponential Moving Averages (EMAs) sitting at around 103.782.

For a bullish resumption, the DXY must achieve a daily close above the March 22 high at 103.26. Once done, the DXY could test the confluence of the 20-day EMA and 2017 high at 103.78. If that strong resistance area is broken, the 50-day EMA at 103.97 is up for grabs, ahead of 104.00.

Otherwise, buying weakness could mean that the ongoing leg-up is a correction of a continued downtrend. That said, the US Dollar Index’s first support would be 103.00. A breach of the latter will expose the March 23 swing low at 101.91, followed by the YTD low at 100.85.

Oscillators, like the Relative Strength Index (RSI), are tracking the trend, though it remains bearish. Contrarily, the Rate of Change (RoC) shows that sellers’ momentum is waning, about to turn neutral.

US Dollar Index Daily chart

US Dollar Index Daily chart

US Dollar Index Technical levels

Dollar Index Spot

Overview
Today last price103.13
Today Daily Change0.52
Today Daily Change %0.51
Today daily open102.61
 
Trends
Daily SMA20104.31
Daily SMA50103.44
Daily SMA100104.22
Daily SMA200106.78
 
Levels
Previous Daily High102.63
Previous Daily Low101.92
Previous Weekly High105.11
Previous Weekly Low103.44
Previous Monthly High105.36
Previous Monthly Low100.81
Daily Fibonacci 38.2%102.36
Daily Fibonacci 61.8%102.19
Daily Pivot Point S1102.14
Daily Pivot Point S2101.67
Daily Pivot Point S3101.43
Daily Pivot Point R1102.85
Daily Pivot Point R2103.1
Daily Pivot Point R3103.57

Author

Christian Borjon Valencia

Christian Borjon began his career as a retail trader in 2010, mainly focused on technical analysis and strategies around it. He started as a swing trader, as he used to work in another industry unrelated to the financial markets.

More from Christian Borjon Valencia
Share:

Markets move fast. We move first.

Orange Juice Newsletter brings you expert driven insights - not headlines. Every day on your inbox.

By subscribing you agree to our Terms and conditions.

Editor's Picks

EUR/USD eases from around 1.1800 after US GDP figures

The US Dollar is finding some near-term demand after the release of the US Q3 GDP. According to the report, the economy expanded at an annualized rate of 4.3% in the three months to September, well above the 3.3% forecast by market analysts.

GBP/USD retreats below 1.3500 on modest USD recovery

GBP/USD retreats from session highs and trades slightly below 1.3500 in the second half of the day on Tuesday. The US Dollar stages a rebound following the better-than-expected Q3 growth data, limiting the pair's upside ahead of the Christmas break.

Gold: Record rally sustains above $4,500 on safe-haven flows

Gold sustains the record-setting rally above $4,500 in the Asian session on Wednesday. The Israel-Iran conflict and the escalating US-Venezuela tensions boost safe-haven flows into Gold. Furthermore, US Q3 GDP data fails to lift the US Dollar amid growing bets for two Fed rate cuts in 2026, underpinning the non-yielding bullion. 

The crypto market is preparing us for a deeper global sell-off

The crypto market capitalisation fell by 1.4% to $2.97T, falling below the $3T mark once again. The market was unable to repeat the robust rebound from the local bottom, as it did after 23 November and 2 December, indicating increased pressure from sellers.

Ten questions that matter going into 2026

2026 may be less about a neat “base case” and more about a regime shift—the market can reprice what matters most (growth, inflation, fiscal, geopolitics, concentration). The biggest trap is false comfort: the same trades can look defensive… right up until they become crowded.

Dogecoin ticks lower as low Open Interest, funding rate weigh on buyers

Dogecoin extends its decline as risk-off sentiment dominates across the crypto market. DOGE’s derivatives market remains weak amid suppressed futures Open Interest and perpetual funding rate.