|

US Dollar Index Price Analysis: Attempts to retrace its recent losses, trades near 102.20

  • US Dollar Index struggles to halt losses amid dovish Fed’s outlook.
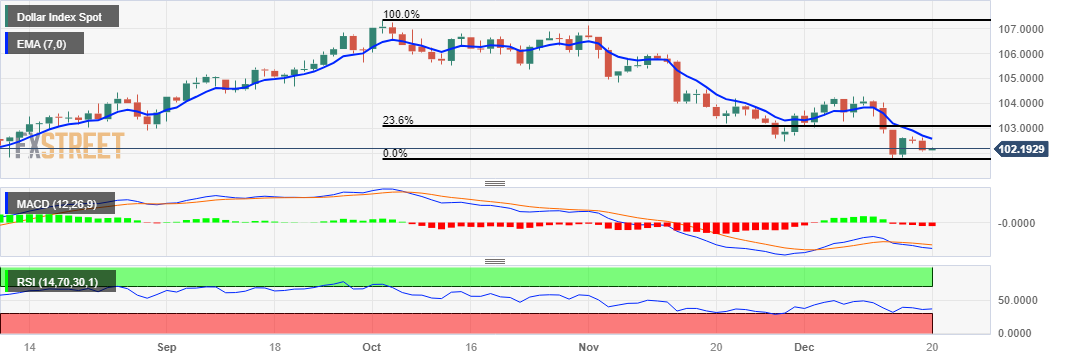
  • Technical indicators suggest that DXY could test the support region around the weekly low at 102.06.
  • The major level at 102.50 could act as a key barrier followed by the seven-day EMA at 102.58.

The US Dollar Index (DXY) rebounds after two days of losses, trading around 102.20 during the Asian session on Wednesday. However, the DXY faces challenges due to the Federal Reserve’s (Fed) dovish outlook on the interest rates trajectory. Investors expect the Fed to implement rate cuts in early 2024.

However, during a Wednesday interview on Fox TV, Chicago Fed President Austan Goolsbee commented that the "market has gotten ahead of themselves on euphoria" regarding potential interest rate cuts.

The 14-day Relative Strength Index (RSI) is below the 50 level, signaling a bearish sentiment. Additionally, the negative positioning of the Moving Average Convergence Divergence (MACD) line below the centerline, and showing the divergence below the signal line could serve as confirmation of the bearish momentum for the Dollar Index in the market.

The lagging indicators suggest that the US Dollar Index could test the psychological support region around the weekly low at 102.06 level before the 102.00 level. A firm break below the key support region could put pressure on the DXY to navigate December’s low at 101.77 level followed by the 101.50 major level.

On the upside, The DXY could find the key resistance around the 102.50 major level before the seven-day Exponential Moving Average (EMA) at 102.58 lined up with the weekly high at 102.63 level.

A breakthrough above the resistance area could support the Dollar Index buyers to approach the psychological level at 103.00 near the 23.6% Fibonacci retracement at 103.08 level.

Dollar Index: Daily Chart

Dollar Index Spot: Additional technical levels

Overview
Today last price102.16
Today Daily Change0.04
Today Daily Change %0.04
Today daily open102.12
 
Trends
Daily SMA20103.3
Daily SMA50104.72
Daily SMA100104.61
Daily SMA200103.5
 
Levels
Previous Daily High102.63
Previous Daily Low102.06
Previous Weekly High104.27
Previous Weekly Low101.77
Previous Monthly High107.11
Previous Monthly Low102.47
Daily Fibonacci 38.2%102.28
Daily Fibonacci 61.8%102.41
Daily Pivot Point S1101.91
Daily Pivot Point S2101.71
Daily Pivot Point S3101.35
Daily Pivot Point R1102.48
Daily Pivot Point R2102.83
Daily Pivot Point R3103.04

Author

Akhtar Faruqui

Akhtar Faruqui is a Forex Analyst based in New Delhi, India. With a keen eye for market trends and a passion for dissecting complex financial dynamics, he is dedicated to delivering accurate and insightful Forex news and analysis.

More from Akhtar Faruqui
Share:

Markets move fast. We move first.

Orange Juice Newsletter brings you expert driven insights - not headlines. Every day on your inbox.

By subscribing you agree to our Terms and conditions.

Editor's Picks

EUR/USD moves sideways below 1.1800 on Christmas Eve

EUR/USD struggles to find direction and trades in a narrow channel below 1.1800 after posting gains for two consecutive days. Bond and stock markets in the US will open at the usual time and close early on Christmas Eve, allowing the trading action to remain subdued. 

GBP/USD keeps range around 1.3500 amid quiet markets

GBP/USD keeps its range trade intact at around 1.3500 on Wednesday. The Pound Sterling holds the upper hand over the US Dollar amid pre-Christmas light trading as traders move to the sidelines heading into the holiday season. 

Gold retreats from record highs, trades below $4,500

Gold retreats after setting a new record-high above $4,520 earlier in the day and trades in a tight range below $4,500 as trading volumes thin out ahead of the Christmas break. The US Dollar selling bias remains unabated on the back of dovish Fed expectations, which continues to act as a tailwind for the bullion amid persistent geopolitical risks.

Bitcoin slips below $87,000 as ETF outflows intensify, whale participation declines

Bitcoin price continues to trade around $86,770 on Wednesday, after failing to break above the $90,000 resistance. US-listed spot ETFs record an outflow of $188.64 million on Tuesday, marking the fourth consecutive day of withdrawals.

Economic outlook 2026-2027 in advanced countries: Solidity test

After a year marked by global economic resilience and ending on a note of optimism, 2026 looks promising and could be a year of solid economic performance. In our baseline scenario, we expect most of the supportive factors at work in 2025 to continue to play a role in 2026.

Avalanche struggles near $12 as Grayscale files updated form for ETF

Avalanche trades close to $12 by press time on Wednesday, extending the nearly 2% drop from the previous day. Grayscale filed an updated form to convert its Avalanche-focused Trust into an ETF with the US Securities and Exchange Commission.