|

US Dollar Index falls back below 107.00 but downside remains limited as Treasury yields remain high

  • The US Dollar Index sees a mild decline for Wednesday, slipping back past the 107.00 level.
  • Downside momentum likely to remain limited as US Treasury yields, US economic data continue to hold on the high end.
  • The DXY is up 3.2% on the year, 7.25% from 2023's lows.

The US Dollar Index (DXY) saw some minor declines on Wednesday, with the major currency index declining around 0.3% for the mid-week trading session.

The Dollar Index has drifted away from the week's eleven-month high at 107.35, but downside moves are likely to remain limited as the DXY remains bolstered by rising US Treasury yields and an overall healthy economic outlook for the US economy, albeit with a few hotspots.

Forex Today: Dollar slides but still rules

US Treasuries saw continued upside for Wednesday, with the 10-year Treasury yield hitting 4.88% during the day's trading, a seventeen-year high.

US ADP employment data showed an 89K uptick in private payroll positions, far below the forecast 153K, but jobs are still being created in the US economy.

Next up on Thursday will be US Jobless Claims, and investors will be looking ahead to Friday's Non-Farm Payrolls (NFP), which is forecast to show a minor downtick from 187K to 170K.

DXY technical outlook

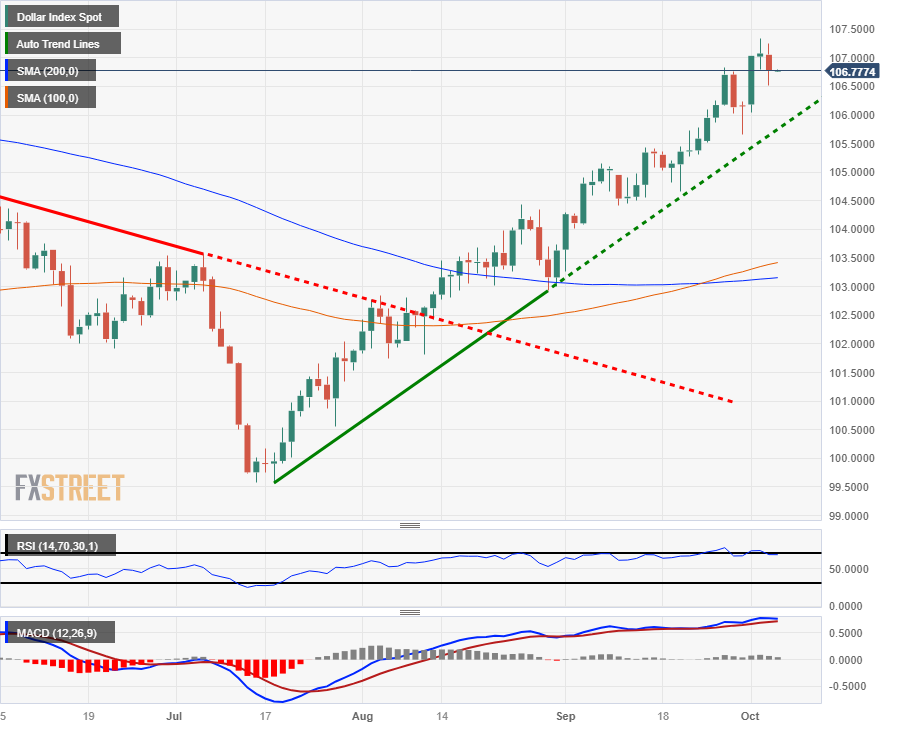
The US Dollar Index opened up Wednesday trading falling to an intraday low of 106.51 before catching an early ride to a daily high of 106.99, but was unable to hold onto the 107.00 handle and enters the Thursday trading session cycling 106.80.

Intraday price action is catching technical support from the 100-hour Simple Moving Average (SMA) near 106.60, with the 200-hour SMA pushing into 160.40.

The DYX continues to rise from the year's lows, riding a bullish trendline from 99.50 and long-term Dollar bulls will be looking to make a decisive push into 108.00.

DXY daily chart
DXY technical levels

Dollar Index Spot

Overview
Today last price106.77
Today Daily Change-0.31
Today Daily Change %-0.29
Today daily open107.08
 
Trends
Daily SMA20105.57
Daily SMA50104.05
Daily SMA100103.35
Daily SMA200103.13
 
Levels
Previous Daily High107.35
Previous Daily Low106.8
Previous Weekly High106.84
Previous Weekly Low105.52
Previous Monthly High106.84
Previous Monthly Low103.27
Daily Fibonacci 38.2%107.14
Daily Fibonacci 61.8%107.01
Daily Pivot Point S1106.8
Daily Pivot Point S2106.53
Daily Pivot Point S3106.25
Daily Pivot Point R1107.35
Daily Pivot Point R2107.62
Daily Pivot Point R3107.9

Author

Joshua Gibson

Joshua joins the FXStreet team as an Economics and Finance double major from Vancouver Island University with twelve years' experience as an independent trader focusing on technical analysis.


More from Joshua Gibson
Share:

Editor's Picks

GBP/USD: Downward-sloping trendline near 1.3470 remains key barrier

The British pound faces selling pressure against its major currency peers, trading 0.1% lower at around 1.3420 against the US Dollar during the European trading session on Tuesday.

Euro clings to the bid bias above 1.1500

EUR/USD has picked up pace, reversing Monday’s decline and advancing past the 1.1500 barrier on Tuesday. In the meantime, hopes for a diplomatic solution to the Middle East crisis keep the US Dollar under modest downside pressure, helping spot in its recovery.

Coinbase Bitcoin Premium Index extends historical negative streak as risk appetite deteriorates
The Coinbase Bitcoin Premium Index extends its negative streak to 78 consecutive days on Tuesday, the longest on record. This reading comes amid the ongoing bearish trend, which has seen Bitcoin (BTC) drop by almost 50% from its record high to trade around $64,000.
Why the WTI sell-off may be hiding a supply warning
Prices for the barrel of the American Oil benchmark have fallen sharply as hopes of a US-Iran agreement have resurfaced, but a deeply backwardated Oil curve, tight Cushing stocks and light speculative positioning all warn that the sell-off may have gone too far.
9-3: Is the Federal Reserve’s vote tally Warsh's new forward guidance?
The rate did not move. Neither did the statement, and that’s the more interesting fact. Set the July 29 Federal Open Market Committee (FOMC) statement beside the one issued on June 17, and the two documents are identical apart from a single verb and a paragraph at the bottom naming three dissenters.














