US Dollar Index (DXY) Price Forecast: Seems vulnerable near 100.70; break below 200-period SMA on H4 awaited
- The USD remains on the back foot for the second straight day, though it lacks follow-through selling.
- The technical setup favors bearish trades and supports prospects for a further depreciating move.
- A sustained break below the 200-period SMA on H4 is needed to reaffirm the negative outlook.

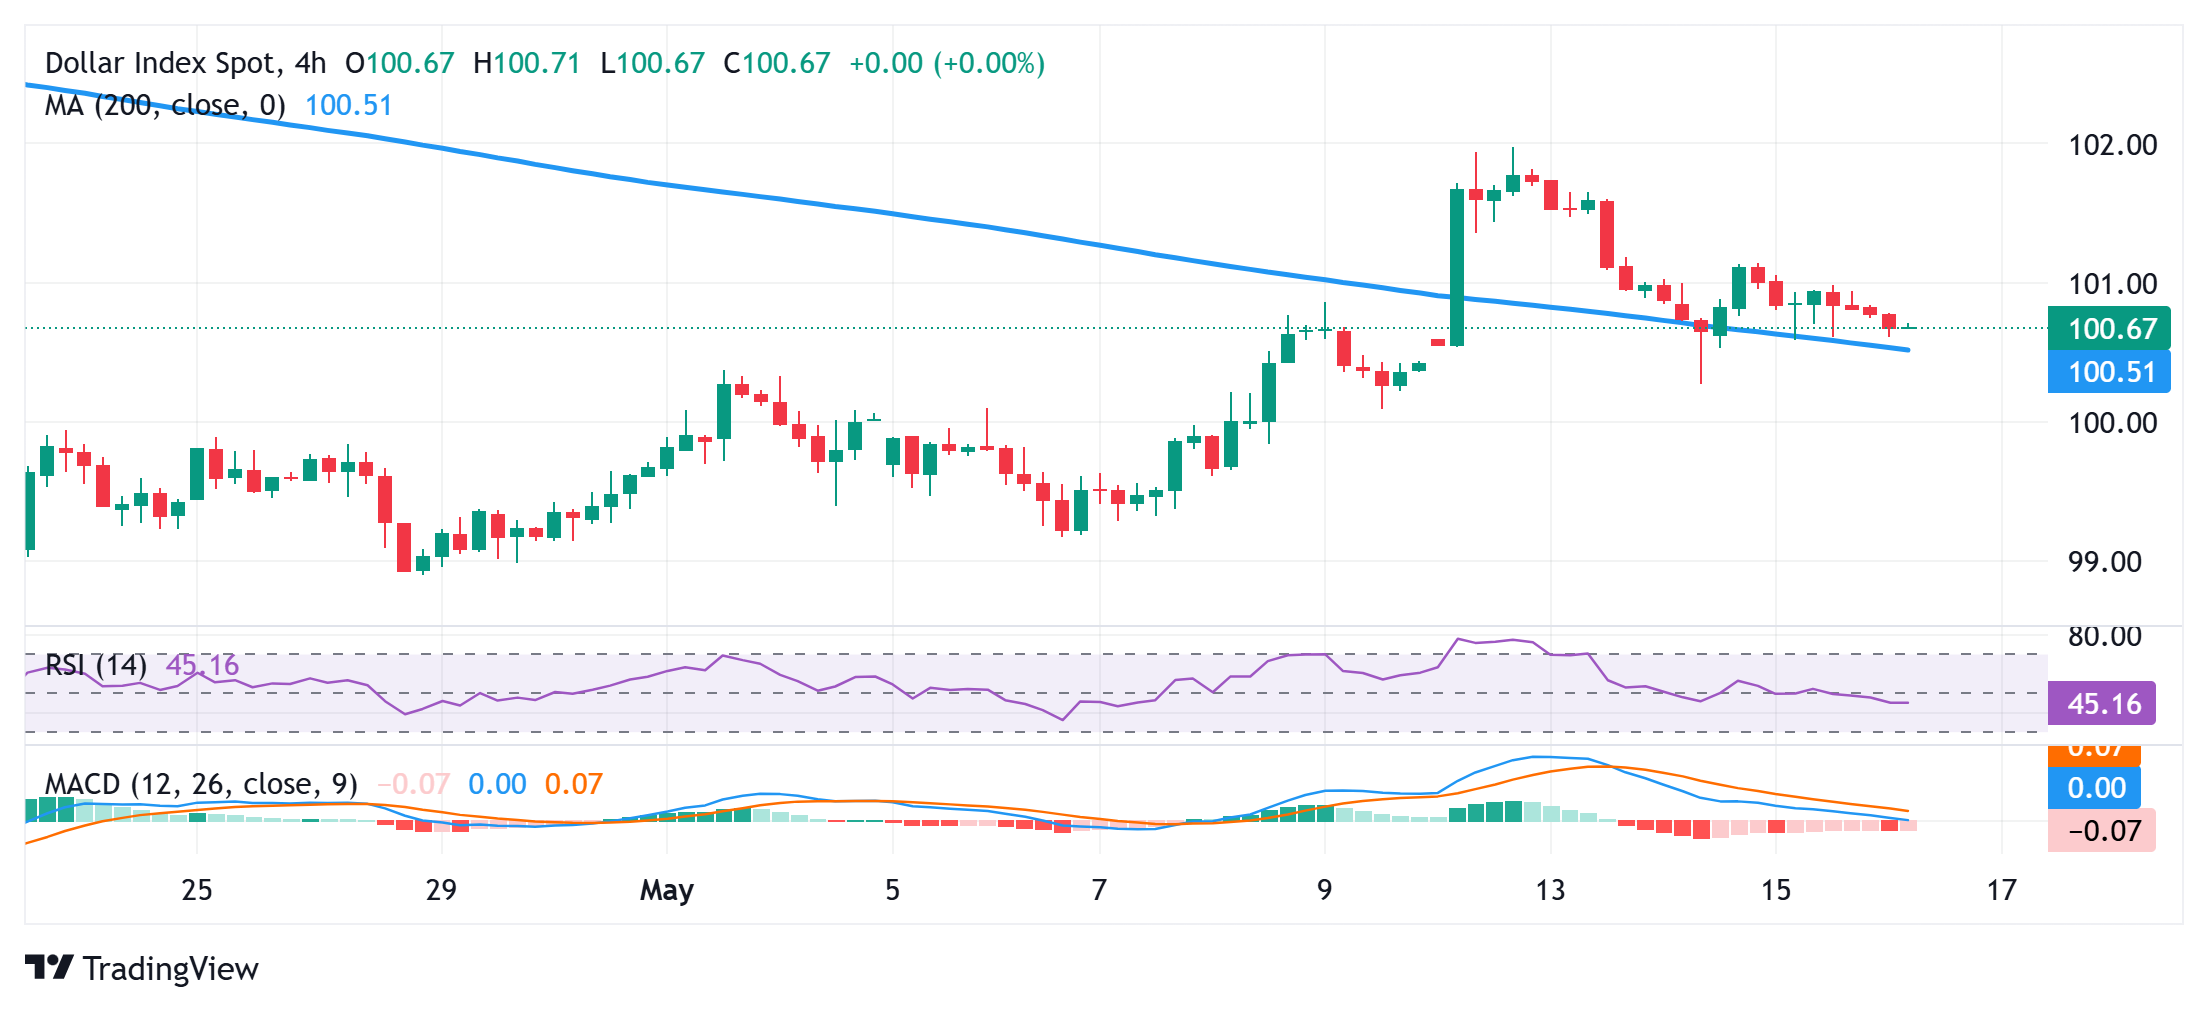
The US Dollar Index (DXY), which tracks the Greenback against a basket of currencies, trades with a negative bias for the second straight day on Friday, though the intraday downtick lacks bearish conviction. The index currently trades around the 100.70 region, down just over 0.10% for the day, and manages to hold above the 200-period Simple Moving Average (SMA) on the 4-hour chart.
Meanwhile, bearish technical indicators on hourly/daily charts support prospects for an eventual breakdown below the said support, currently pegged near the 100.50 region. The subsequent fall could make the DXY vulnerable to extend this week's retracement slide from its highest level since April 10 and test the weekly swing low, around the 100.00 psychological mark touched on Wednesday.
Some follow-through selling will suggest that the recent recovery from the year-to-date low touched on April 21 has run its course and pave the way for deeper losses. The DXY could then fall to the 99.60-99.55 intermediate support en route to the 99.20 area and the 99.00 round-figure mark.
On the flip side, the immediate hurdle is pegged near the 101.00-101.10 region, above which a fresh bout of a short-covering move could lift the DXY to the 101.70 region. The US Dollar (USD) bulls might then make a fresh attempt to conquer the 102.00 mark. A sustained strength beyond the latter might negate any near-term negative bias and pave the way for some meaningful appreciating move.
DXY 4-hour chart
US Dollar FAQs
The US Dollar (USD) is the official currency of the United States of America, and the ‘de facto’ currency of a significant number of other countries where it is found in circulation alongside local notes. It is the most heavily traded currency in the world, accounting for over 88% of all global foreign exchange turnover, or an average of $6.6 trillion in transactions per day, according to data from 2022. Following the second world war, the USD took over from the British Pound as the world’s reserve currency. For most of its history, the US Dollar was backed by Gold, until the Bretton Woods Agreement in 1971 when the Gold Standard went away.
The most important single factor impacting on the value of the US Dollar is monetary policy, which is shaped by the Federal Reserve (Fed). The Fed has two mandates: to achieve price stability (control inflation) and foster full employment. Its primary tool to achieve these two goals is by adjusting interest rates. When prices are rising too quickly and inflation is above the Fed’s 2% target, the Fed will raise rates, which helps the USD value. When inflation falls below 2% or the Unemployment Rate is too high, the Fed may lower interest rates, which weighs on the Greenback.
In extreme situations, the Federal Reserve can also print more Dollars and enact quantitative easing (QE). QE is the process by which the Fed substantially increases the flow of credit in a stuck financial system. It is a non-standard policy measure used when credit has dried up because banks will not lend to each other (out of the fear of counterparty default). It is a last resort when simply lowering interest rates is unlikely to achieve the necessary result. It was the Fed’s weapon of choice to combat the credit crunch that occurred during the Great Financial Crisis in 2008. It involves the Fed printing more Dollars and using them to buy US government bonds predominantly from financial institutions. QE usually leads to a weaker US Dollar.
Quantitative tightening (QT) is the reverse process whereby the Federal Reserve stops buying bonds from financial institutions and does not reinvest the principal from the bonds it holds maturing in new purchases. It is usually positive for the US Dollar.
Author

Haresh Menghani
FXStreet
Haresh Menghani is a detail-oriented professional with 10+ years of extensive experience in analysing the global financial markets.


