The upside-down math of debt

S2N spotlight
In 2010, Professors Carmen Reinhart and Kenneth Rogoff published a paper, Growth in a Time of Debt, which instantly went viral. The main thesis of the paper was that once a government's debt-to-GDP ratio crosses above 90%, a financial crisis and default are around the corner.
This has always been something I have watched closely and considered an important ratio to keep an eye on, despite the fact that Japan has been running a debt-to-GDP ratio of 270% above the 90% threshold for decades.
I am putting aside the kerfuffle that engulfed the above paper when it was discovered that it had an Excel error that nobody spotted at first until other academics couldn’t replicate the results and the professors had to embarrassingly walk back their paper results.
I am closest to the Austrian economic school of thought, so the idea of government debt being ginormous is not something I am cool with. Wait for it; with a bit of mathematical gymnastics I am going to show you something that you probably didn’t give much thought to.
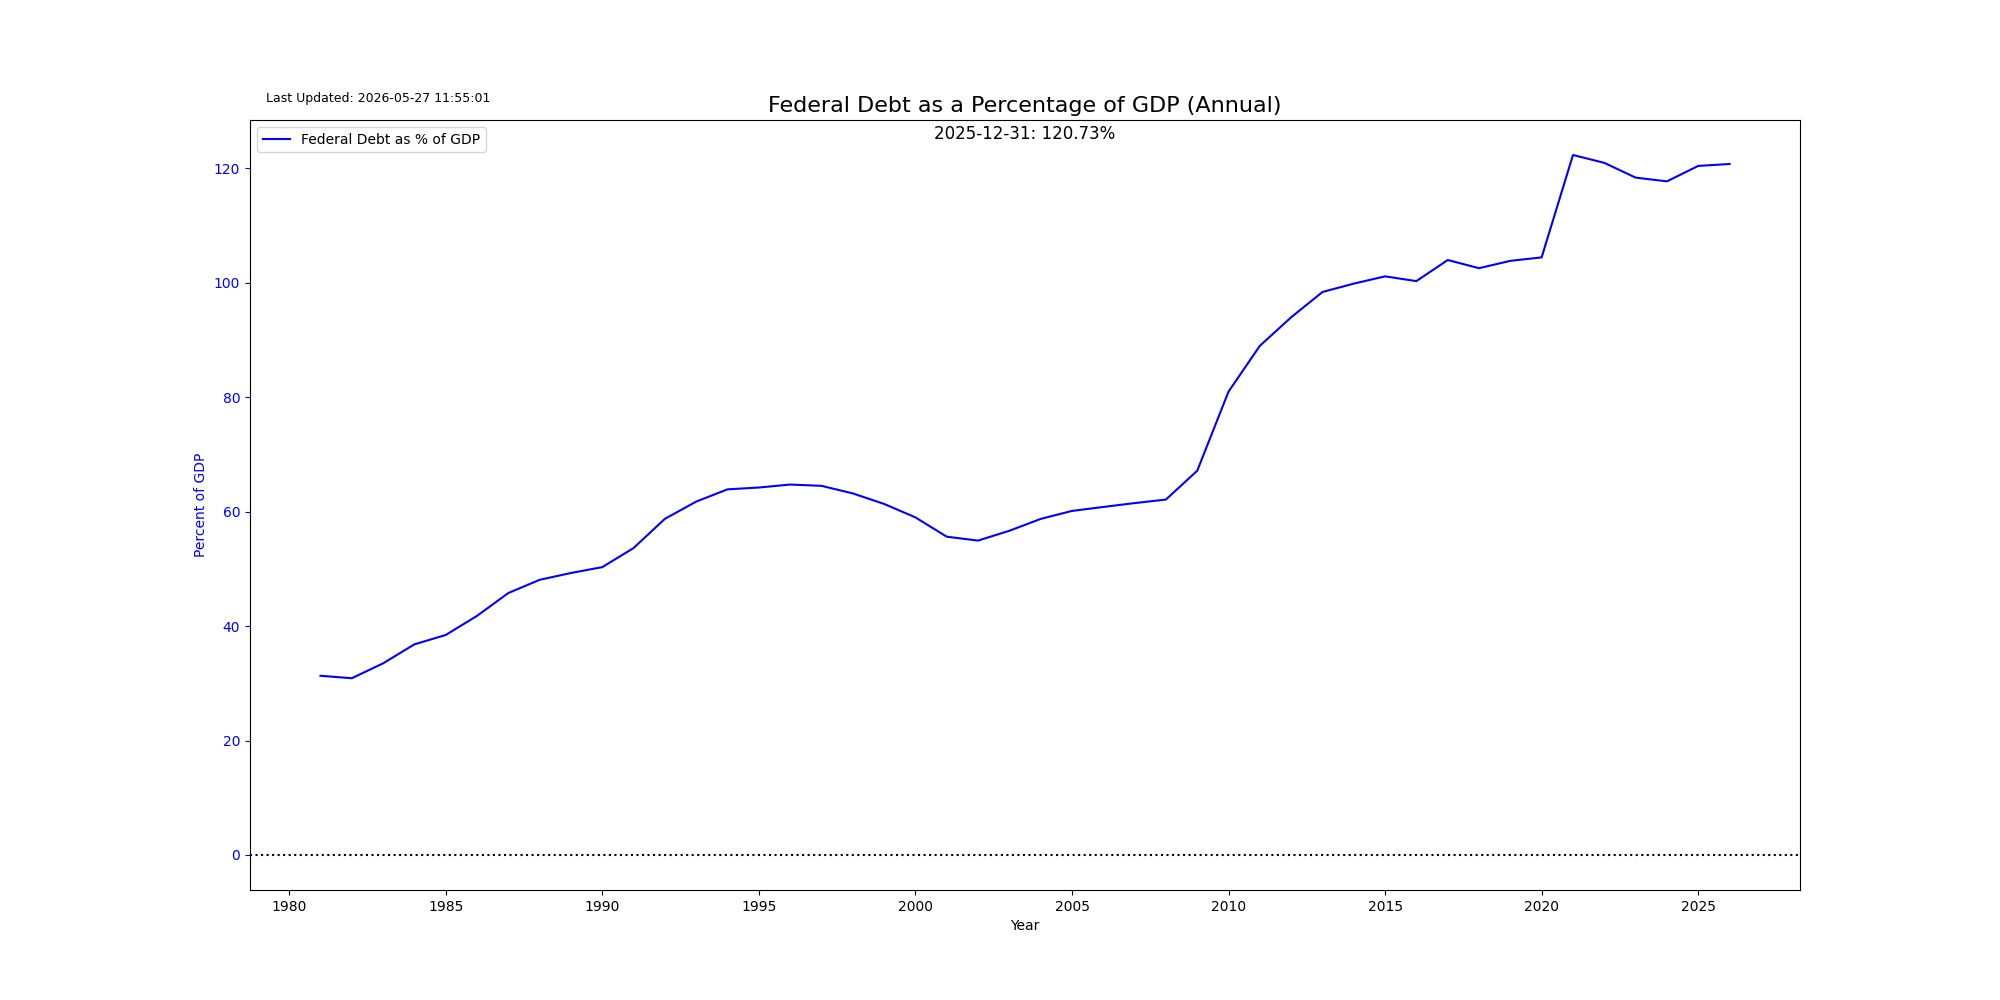
Debt-to-GDP is a ratio.
And ratios can improve even when the debt itself is still rising. That was the aha for me.
Let’s make it concrete.
Say GDP is 100 and government debt is 120. That gives you a debt-to-GDP ratio of 120%.
.Now imagine nominal GDP grows by 7% a year for five years. That kind of growth does not have to be all “real” growth. Some of it can simply be inflation, because GDP is measured in nominal dollars. In other words, the denominator rises with both real growth and higher prices.
If the government ran a balanced budget for those five years, debt would stay at 120 while GDP would rise to about 140.
So after five years:
- Debt = 120.
- GDP = 140.
- Debt/GDP = about 86%.
That is a huge drop. From 120% to 86%, without paying down the debt in giant chunks. That alone was enough to change how I think about the problem. But the more interesting example is that you do not even need a balanced budget.
Let’s say the government runs a deficit of 2% of GDP each year.
Start here:
- Year 0: GDP 100, Debt 120, Ratio 120%
Then five years later, assuming 7% nominal GDP growth each year:
- GDP rises to about 140.
- Debt rises to about 131.5.
- Debt/GDP still falls to about 94%.
So debt goes up. But the debt ratio goes down.
That is the key insight I had not properly appreciated.
We often talk about national debt as if the raw debt number is the whole story. But it is not. What matters is whether debt is growing faster or slower than nominal GDP.
Once you see that, the question about how the hell we are going to pay the debt back becomes reframed as to whether we can grow the nominal GDP enough to outpace the growth in the debt to soften the ratio.
This is where inflation helps the math because it lifts nominal GDP, but it is not a free lunch. Too much inflation creates its own problems, including higher interest costs and economic distortions. So this is not an argument that inflation “solves” debt. It is just a reminder that the arithmetic is far less dramatic than the headlines make it sound.
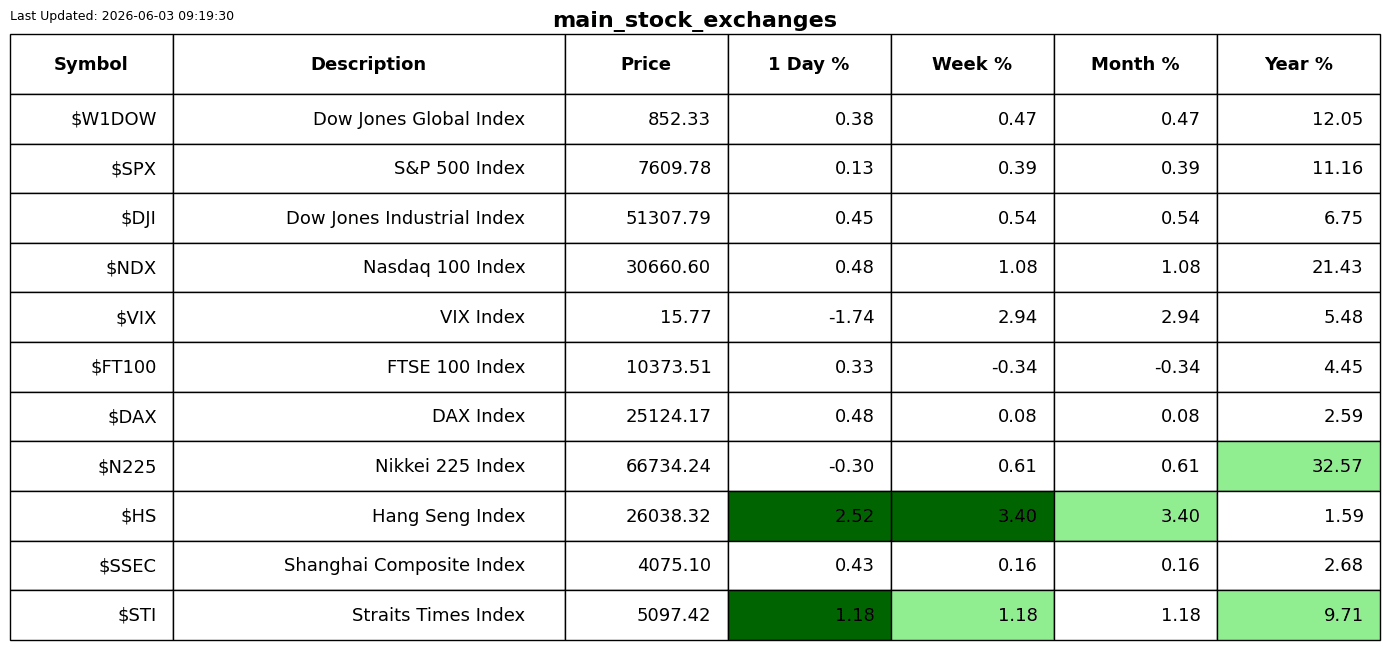
I was not going to write what I just did, as I wanted to focus the spotlight on the distortion the 3 big IPOs, SpaceX, Anthropic and OpenAI, are causing to the indices. As you can see, there has never been anything as big as the SpaceX IPO, and the “players” are on their knees trying to get a piece of the action.

However, this upside-down idea of the denominator is actually a wonderful introduction to the main observation of the past 24 hours. That is Bitcoin and Strategy’s behaviour.
S2N observations
Michael Saylor was quoted saying a few months ago. “Sell a kidney if you must, but don’t sell the Bitcoin.”
About 18 months ago the market was concerned whether Strategy could pay its dividend on one of its corporate debt tranches. To put the market at ease, they raised $2 billion to cover the dividend. What did Saylor do when the price of Bitcoin started tanking? Instead of maintaining the cash for the dividend cover it was intended for, he went spendies and spent most of the $2 billion buying Bitcoin.
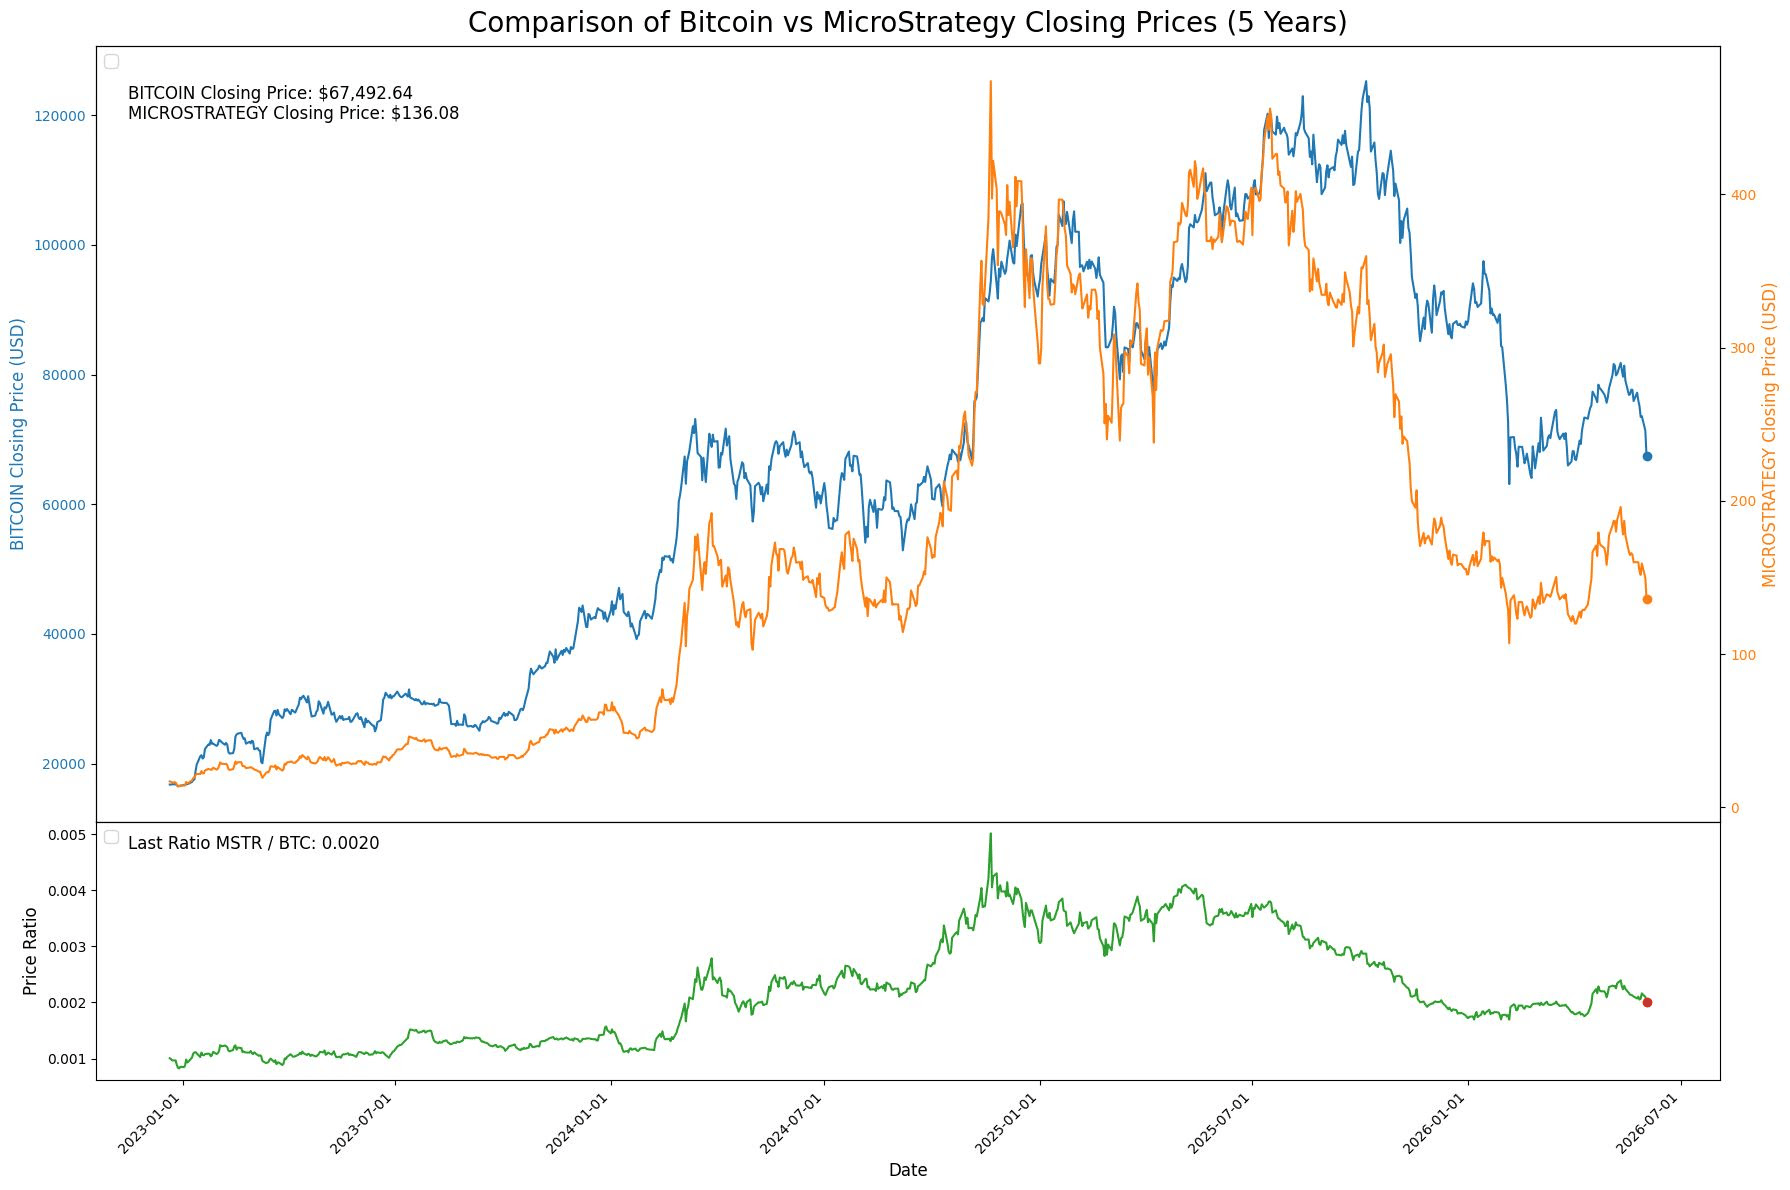
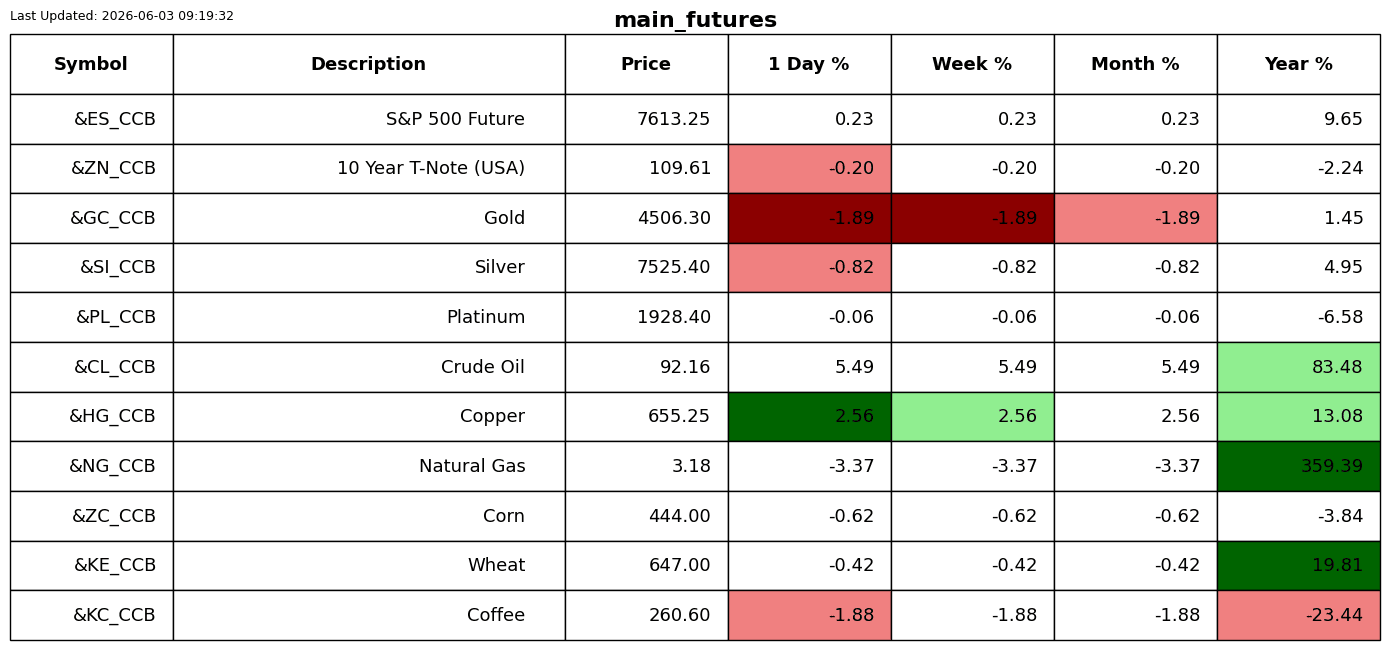
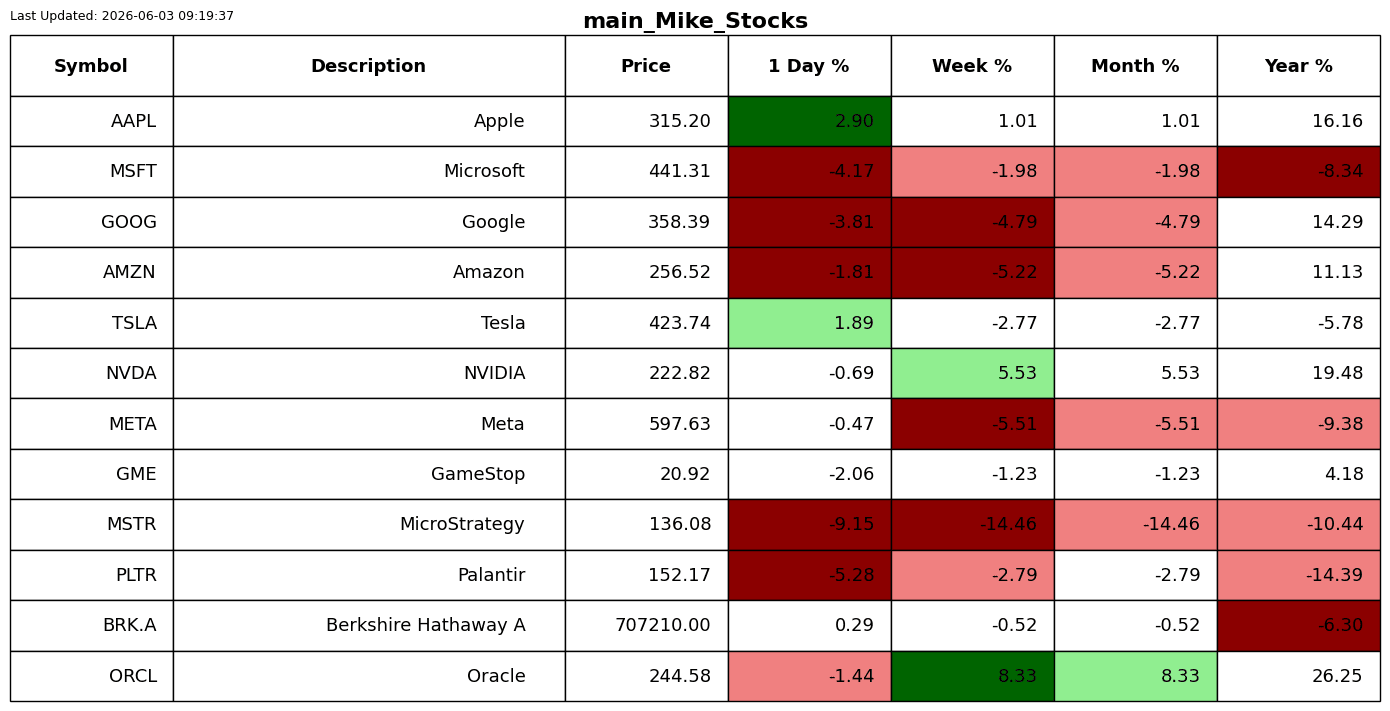
Yesterday Strategy did something Saylor swore they would never do: they sold 32 Bitcoin to raise money. A paltry $2.5 million. The company holds 843,706 BTC at an average cost of $75,701 per coin. That position is now sitting at a $6 billion unrealised loss.
The market cap has fallen from over $160 billion to $48.2 billion in 11 months, wiping out $111.8 billion in value.
If you have been reading me for a while, you know that I have been pushing the short $MSTR and long Bitcoin. I am on the record as saying I am riding the green ratio line all the way onto the shore.
I want to also place on the record that I think we are now in bubble territory with the market I believe, getting ahead of itself.
Yes, I have said for some time that the market is expensive. I am a believer that AI is going to change things and that growth may even accelerate, as Dario Amodei is anticipating real GDP growth of 5 - 10% with 10% unemployment. The problem is that most of the wealth will pass to only a few.
Coming back to my comment about the markets being expensive. Let me end with a true story by, I think, the greatest global macro trader of all time, Stanley Druckenmiller.
He spoke about his emotions during the tech bubble. He worked for George Soros’s Quantum Fund and correctly believed disaster loomed. He bet against tech stocks near the end of 1999, a bit too early. Licking his wounds, Druckenmiller then found it impossible not to buy instead as competitors scored huge gains.
“So like around March I could feel it coming. I just. I had to play. I couldn’t help myself. And three times the same week I pick up a—‘don’t do it. Don’t do it.’ Anyway, I pick up the phone finally. I think I missed the top by an hour. I bought $6 billion worth of tech stocks, and in six weeks I had left Soros and I had lost $3 billion in that one play.”
Don’t be that guy; second chances are rare, and you are probably not nearly as talented as Stan Druckenmiller.
S2N screener alert
Skipping today.
S2N performance review


S2N chart gallery
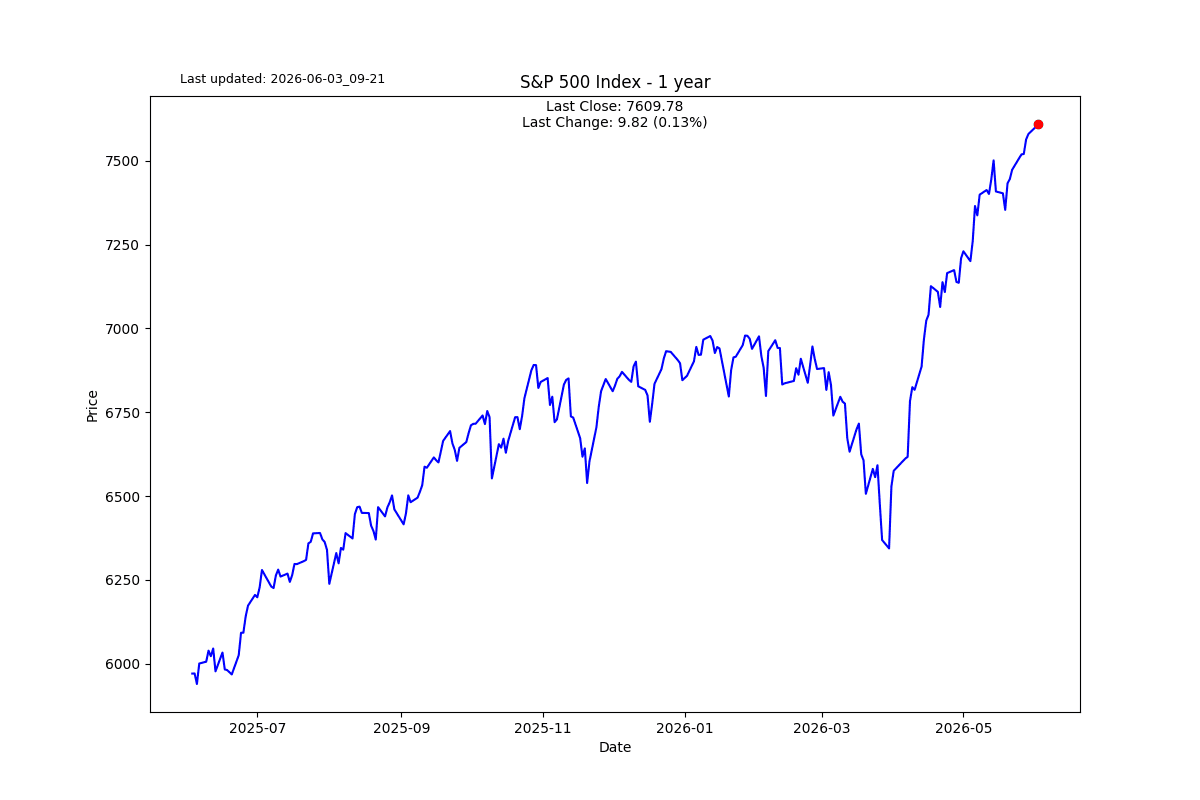
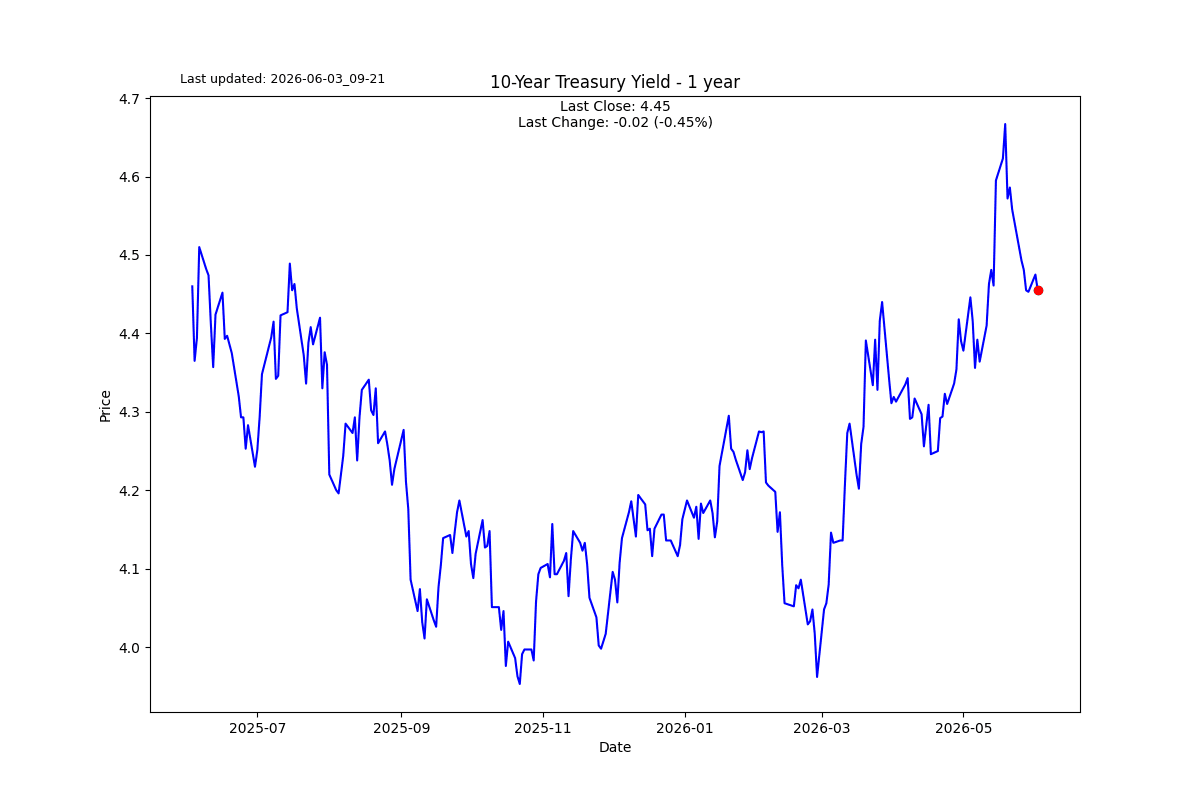
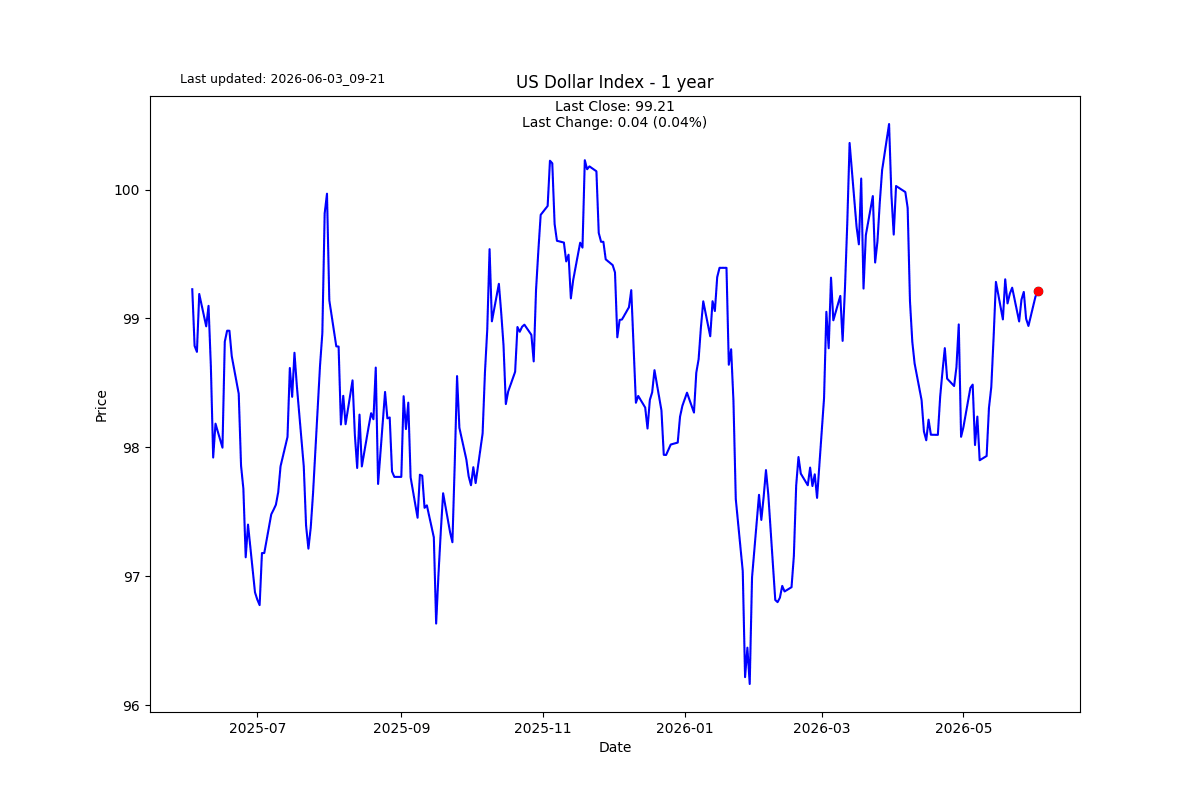
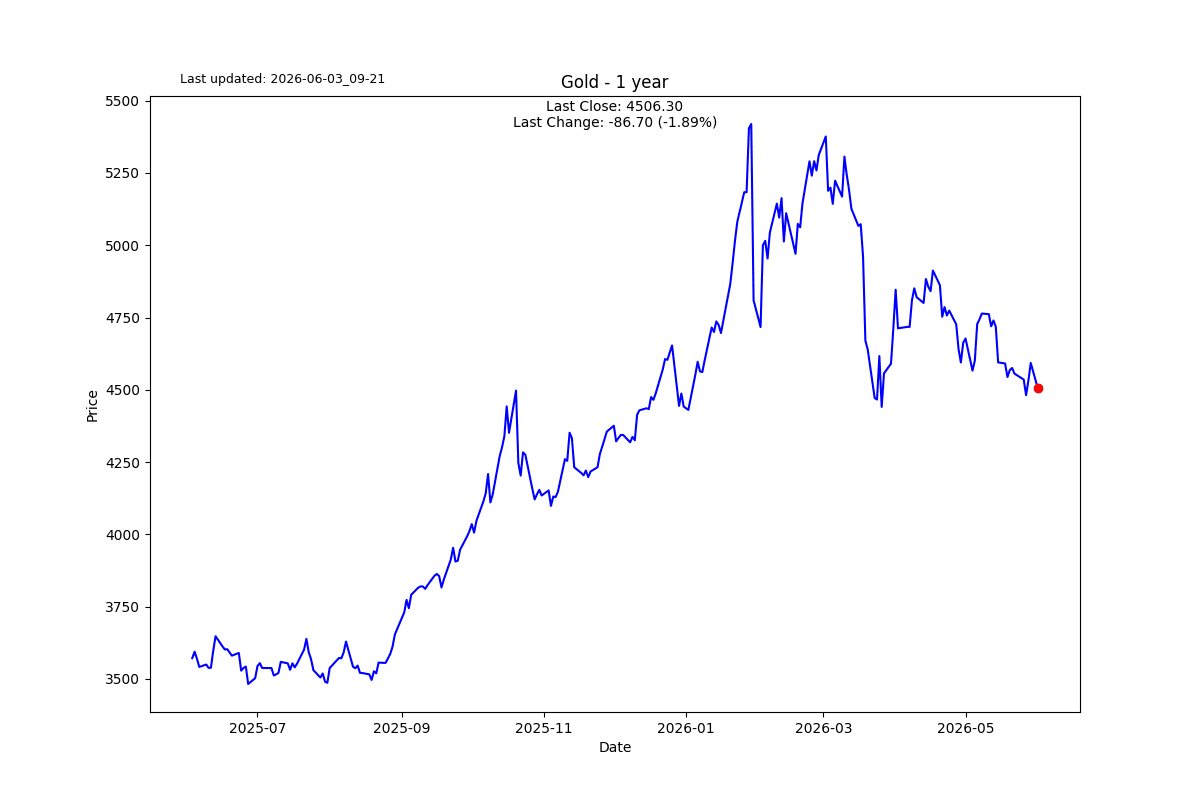
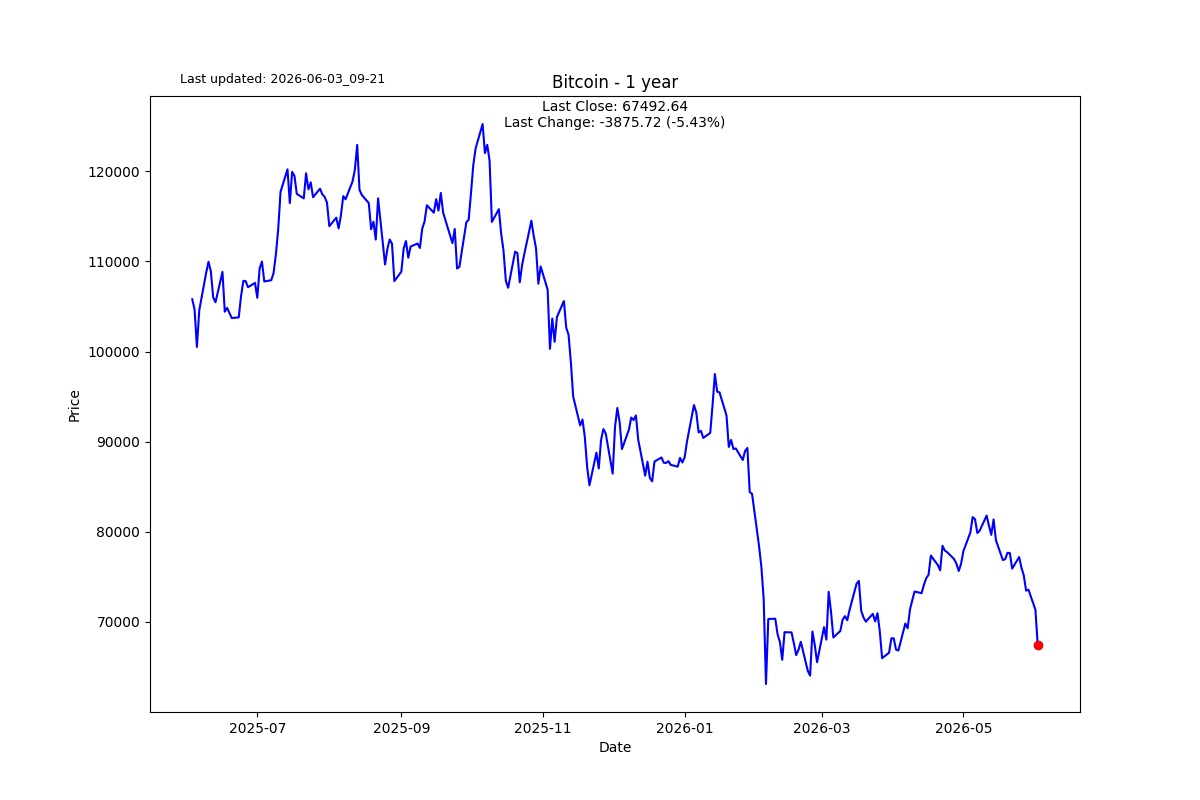
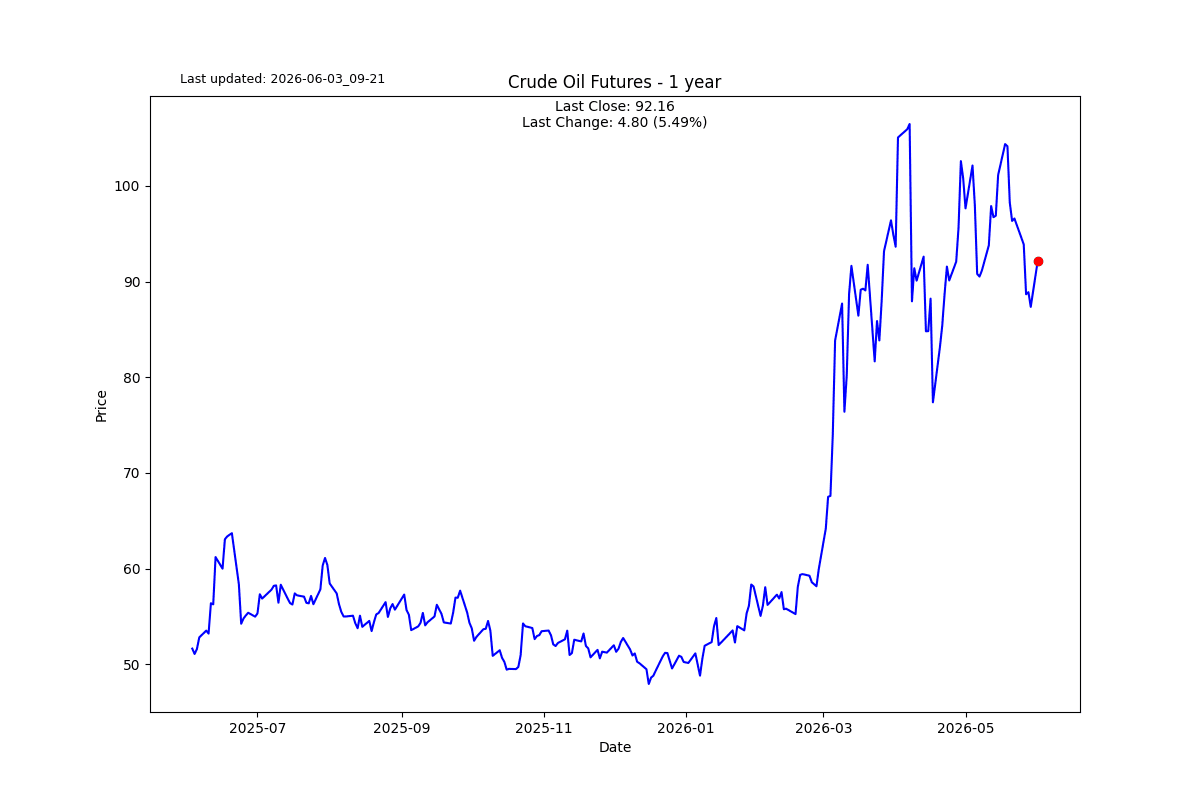
If you are wondering why the price is below $100, it’s a back-adjusted future.
Author

Michael Berman, PhD
Signal2Noise (S2N) News
Michael has decades of experience as a professional trader, hedge fund manager and incubator of emerging traders.