|

US Dollar Index Asia Price Forecast: DXY pops above 99.00 figure in fresh 2020 highs

  • DXY broke above the 99.00 figure as the index is printing fresh 2020 highs. 
  • DXY bulls are eyeing at the 99.40 resistance on the way up.  
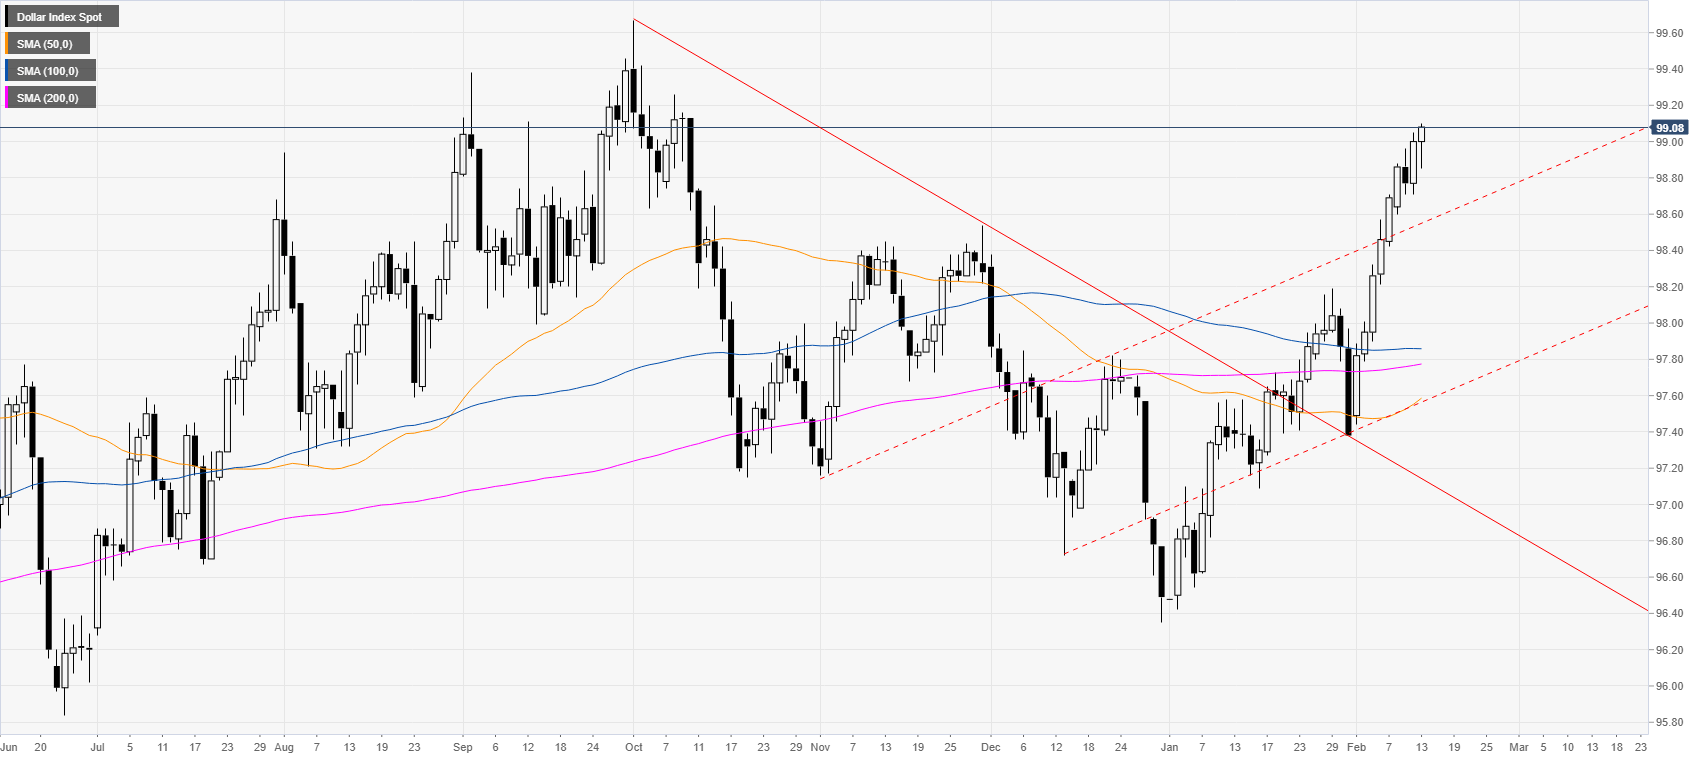
 

DXY daily chart

 
The US dollar index (DXY) is trading near its highest point since October while trading above the main daily simple moving averages (SMAs). The market is spiking to the upside printing a fresh 2020 high this Thursday. 
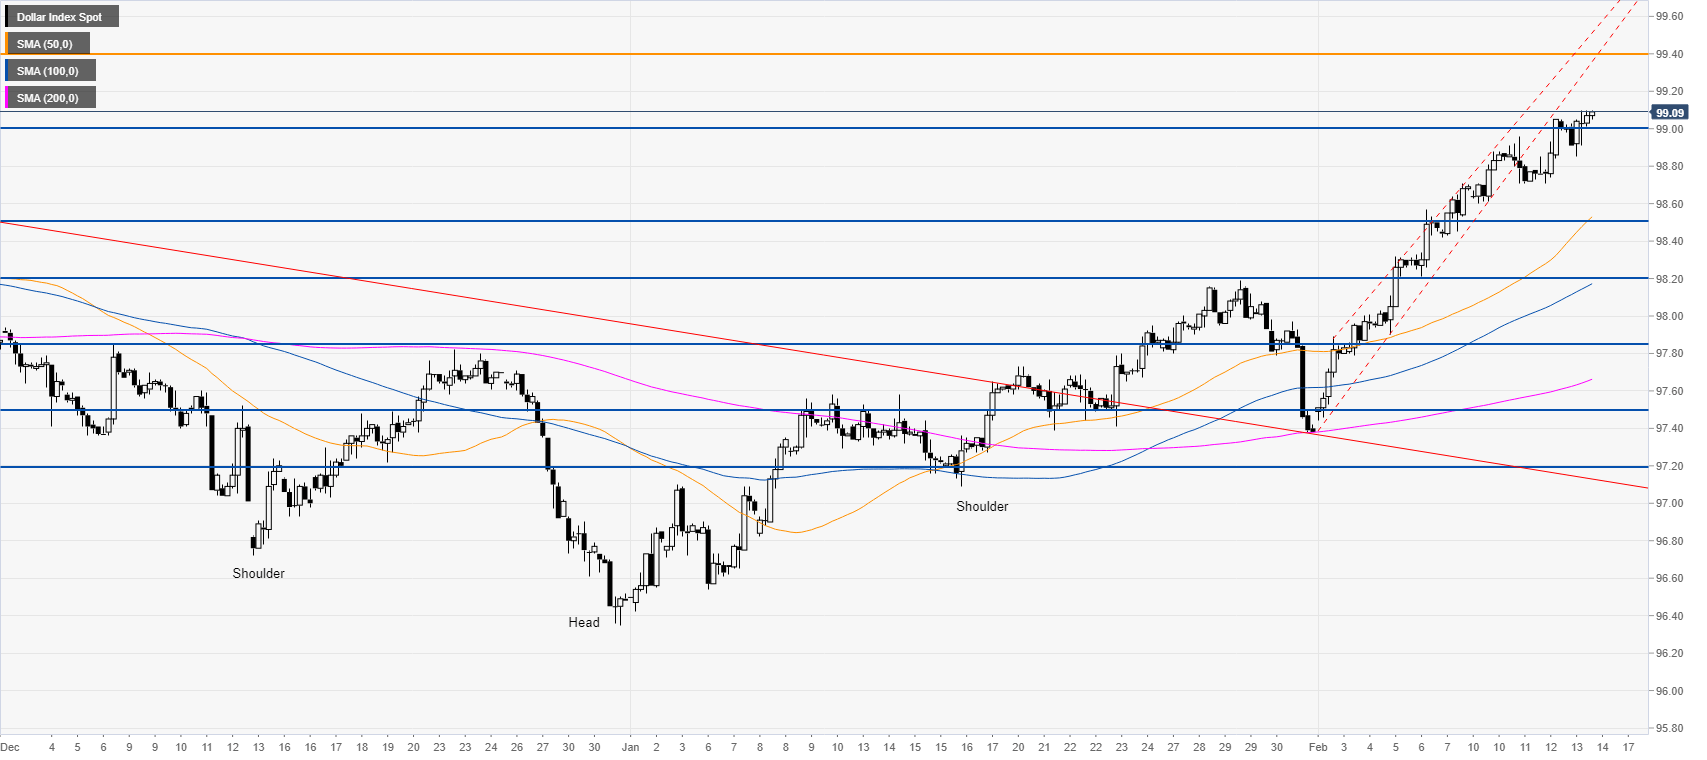
 

DXY four-hour chart

 
DXY broke above the 99.00 figure as the market is trading well above its main SMAs. The bullish pressure remains unabated as bulls are looking to extend gains to the 99.40 resistance. Support is seen at the 99.00 figure and 98.50 level. 
 

Additional key levels

Dollar Index Spot

Overview
Today last price99.08
Today Daily Change0.08
Today Daily Change %0.08
Today daily open99
 
Trends
Daily SMA2098.01
Daily SMA5097.55
Daily SMA10097.86
Daily SMA20097.77
 
Levels
Previous Daily High99.05
Previous Daily Low98.71
Previous Weekly High98.71
Previous Weekly Low97.44
Previous Monthly High98.19
Previous Monthly Low96.42
Daily Fibonacci 38.2%98.92
Daily Fibonacci 61.8%98.84
Daily Pivot Point S198.79
Daily Pivot Point S298.58
Daily Pivot Point S398.45
Daily Pivot Point R199.13
Daily Pivot Point R299.26
Daily Pivot Point R399.47

Author

Flavio Tosti

Flavio Tosti

Independent Analyst


More from Flavio Tosti
Share:

Editor's Picks

EUR/USD challenges 1.1700, six-week lows

EUR/USD remains under heavy downside pressire in quite a dfrreadful start to the new trading week, putting the 1.1700 support to the test amid the marked rebound in the US Dollar. The flight-so-safety environment continues to support the Greenback following the escalating conflict in the Middle East.

GBP/USD hits new yearly lows near 1.3300

GBP/USD adds to the recent bearish tone, approaching to the key 1.3300 support to reach fresh YTD troughs against the backdrop of the robust performance of the US Dollar. Indeed, Cable’s decline comes amid the firm demand for the safe-haven space in the wake of the US and Israel attacks to Iran.

Gold shifts its attention to $5,600 on fligh-to-safety mood

Gold climbs to levels last seen in late January past the $5,400 mark per troy ounce on Monday. The yellow metal’s strong uptick remains fuelled by incresing geopolitical tensions in the Middle East and the consequent demand for safer assets.

Bitcoin on brink of breakdown amid US-Iran war

Bitcoin (BTC) remains under pressure near the key support level of $65,700. Trading at $66,400 at the time of writing on Monday, a breakdown below this critical level would suggest a deeper correction ahead.

The week ahead: Conflict in the Middle East jolts markets

Events in the Middle East are obviously dominating financial markets this morning. The Brent crude oil price is extending gains and is higher by more than 8%, stock futures are pointing lower and the gold price is higher by more than 2%. 

Pi Network Price Forecast: Core team offloads supply, weighing on PI recovery

Pi Network  hovers below $0.1700, broadly steady at press time on Monday, attempting a recovery after a 2% loss the previous day. Sunday’s decline aligned with nearly 49 million PI tokens offloaded by the Pi Foundation, implying a spike in supply pressure that capped the prevailing four-day recovery.