US Dollar sinks as tariffs are underway while Europe gets united on Ukraine
- The US Dollar faces a big drop on Monday with the Dollar exceptionalism trade breaking up.
- US manufacturing data with the ISM and S&P Global PMI did not move the needle much.
- The US Dollar Index (DXY) sees Friday's gains evaporate and sprint back lower.

The US Dollar Index (DXY), which tracks the performance of the US Dollar (USD) against six major currencies, is sinking towards 106.50, erasing Thursday and Friday's lows at the time of writing on Monday. Market mood improved after European leaders, including Ukrainian President Volodymyr Zelenskyy, showed a willingness to guarantee a peace deal in Ukraine on Sunday. The plan now needs to be backed by the United States (US).
On the economic data front, the focus was on the manufacturing sector in the United States. In addition to the S&P Global Purchase Managers Index (PMI) final reading for February, the Institute for Supply Management (ISM) released its specific manufacturing PMI report. No big changes to report with the DXY heading lower on the back of it.
Daily digest market movers: All mixed
- S&P Global released its Manufacturing PMI final reading for February. A stronger 52.7 came in above 51.6 estimate, from the preliminary reading.
- The ISM has released its report on the Manufacturing sector for February.
- The headline PMI came in softer at 50.3, missing the 50.5 estimate and compared to 50.9 in January.
- The Prices Paid subindex surged to 62.4, beating the 56.2 estimate, coming from 54.9 in January.
- The New Orders component fell to48.6, coming from 55.1 in the January reading.
- Equities are getting mixed with minor gains or losses on the three major US indices.
- The CME Fedwatch Tool projects a 25.4% chance that interest rates will remain at the current range of 4.25%-4.50% in June, with the rest showing a possible rate cut.
- The US 10-year yield trades around 4.19%, further down from last week’s high of 4.574%.
US Dollar Index Technical Analysis: Tariffs are not the DXY's friend
This week could not start with more uncertainty, with many moving parts and ties still loose since Friday’s burst out at the Oval Office. It becomes relatively clear that US data will be seen as being on auto-pilot, while geopolitics will be the main drivers going deeper into 2025. Traders will need to embrace the new regime where one headline could easily snap a nice continuum or trend in any asset, as well as for the US Dollar Index.
On the upside, the 55-day Simple Moving Average (SMA) is the first resistance to watch for any rejection, currently at 107.98. In case the DXY can break above the 108.00 round level, 108.50 is coming back in scope.
On the downside, the 107.00 round level needs to hold as support. Nearby, 106.84 (100-day SMA) and 106.52, as a pivotal level, should act as support and avoid any returns to the lower 106-region.
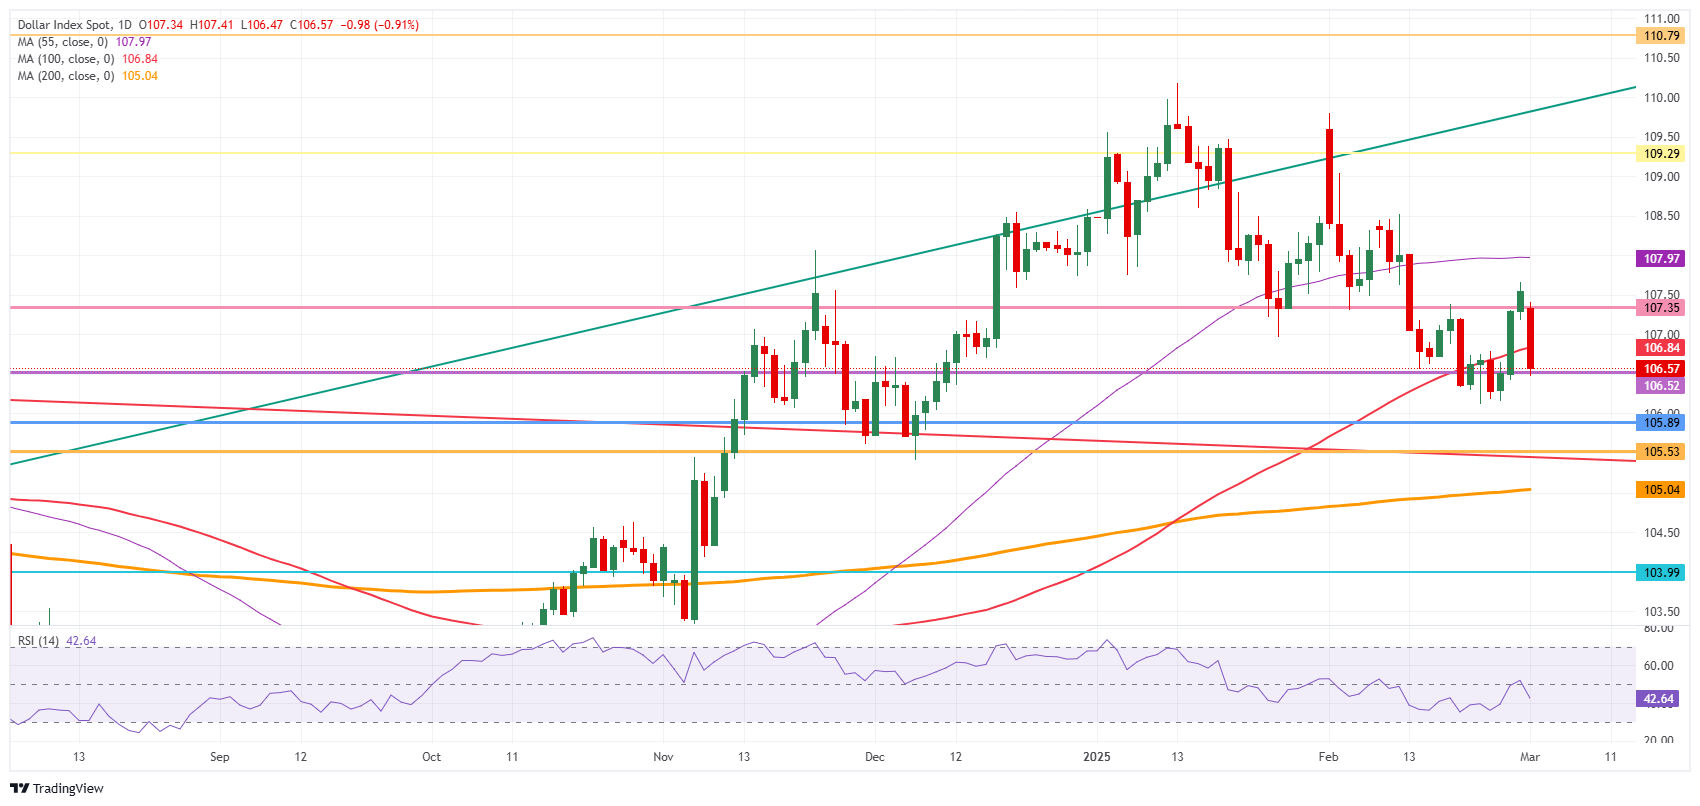
US Dollar Index: Daily Chart
Fed FAQs
Monetary policy in the US is shaped by the Federal Reserve (Fed). The Fed has two mandates: to achieve price stability and foster full employment. Its primary tool to achieve these goals is by adjusting interest rates. When prices are rising too quickly and inflation is above the Fed’s 2% target, it raises interest rates, increasing borrowing costs throughout the economy. This results in a stronger US Dollar (USD) as it makes the US a more attractive place for international investors to park their money. When inflation falls below 2% or the Unemployment Rate is too high, the Fed may lower interest rates to encourage borrowing, which weighs on the Greenback.
The Federal Reserve (Fed) holds eight policy meetings a year, where the Federal Open Market Committee (FOMC) assesses economic conditions and makes monetary policy decisions. The FOMC is attended by twelve Fed officials – the seven members of the Board of Governors, the president of the Federal Reserve Bank of New York, and four of the remaining eleven regional Reserve Bank presidents, who serve one-year terms on a rotating basis.
In extreme situations, the Federal Reserve may resort to a policy named Quantitative Easing (QE). QE is the process by which the Fed substantially increases the flow of credit in a stuck financial system. It is a non-standard policy measure used during crises or when inflation is extremely low. It was the Fed’s weapon of choice during the Great Financial Crisis in 2008. It involves the Fed printing more Dollars and using them to buy high grade bonds from financial institutions. QE usually weakens the US Dollar.
Quantitative tightening (QT) is the reverse process of QE, whereby the Federal Reserve stops buying bonds from financial institutions and does not reinvest the principal from the bonds it holds maturing, to purchase new bonds. It is usually positive for the value of the US Dollar.
Author

Filip Lagaart
FXStreet
Filip Lagaart is a former sales/trader with over 15 years of financial markets expertise under its belt.


