US Dollar plummets to five-month lows post-NFP
- The selling bias in the US Dollar Index gathers steam following NFP.
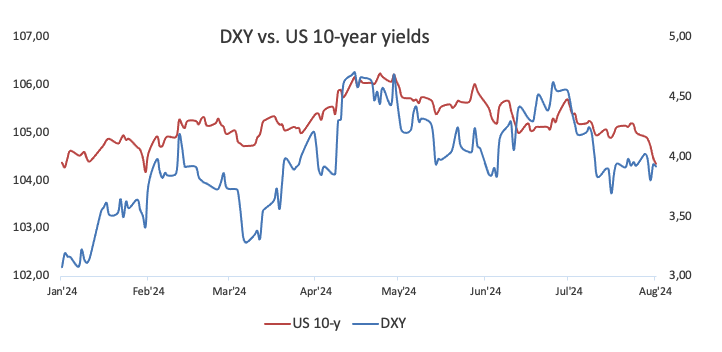
- US yields extend their bearish developments to multi-week lows.
- July Nonfarm Payrolls came in short of estimates in July at 114K.

The US Dollar (USD) accelerates its offered bias and retreats to the area of five-month lows near 103.40 when tracked by the USD Index (DXY). The intense move lower comes in response to weaker-than-expected US Nonfarm Payrolls in July.
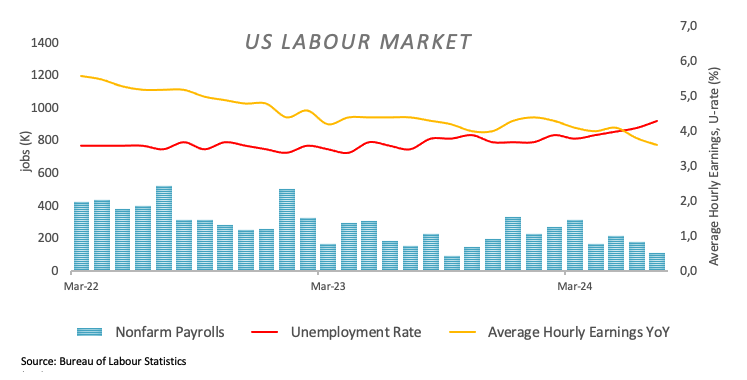
In fact, the Greenback fell off the cliff after the US economy added 114K jobs last month and the Unemployment Rate ticked higher to 4.3% (from 4.1%), while Average Hourly Earnings, a proxy for wage inflation, also came in below expectations.
That said, the index resumed its downtrend following the marked advance experienced on Thursday on the back of persistent risk aversion and a sense of a slowdown in the US economy, particularly after further cooling of the domestic labour market (as per weekly Jobless Claims) and a disenchanting print from the ISM Manufacturing Purchasing Managers Index (PMI) for July (46.8).
In addition, the resurgence of geopolitical jitters, especially in the Middle East, favoured the demand for the safe haven US Dollar in the previous day, which in turn kept the risk-linked complex depressed. The incessant move lower in US yields across different time frames also reinforced the flight-to-safety sentiment.
Absent an FOMC event this month, market participants and the Fed will have two inflation prints and two more labour market reports to further evaluate the likelihood, or not, of an interest rate reduction beyond the summer.
Despite Fed Chair Jerome Powell's dovish message on Wednesday, opening the door to lower rates in September, the statement of the central bank reiterated that further confidence that inflation is heading towards the 2% target is needed to start an easing cycle.
Daily digest market movers: Markets now see a 50 bps rate cut
- The US Dollar tumbles to multi-month lows following HFP readings.
- The US economy created 114K jobs in July, and the Unemployment Rate rose to 4.3%.
- The probability of a 50 bps rate cut in September picks up pace.
- Factory Orders will also be under scrutiny amidst renewed slowdown concerns.
- Yields maintain their firm downtrend and navigate multi-week lows across different maturity periods.
- Unabated geopolitical concerns in the Middle East remain a source of strength for the Greenback for the time being.
Short-term technicals on the US Dollar
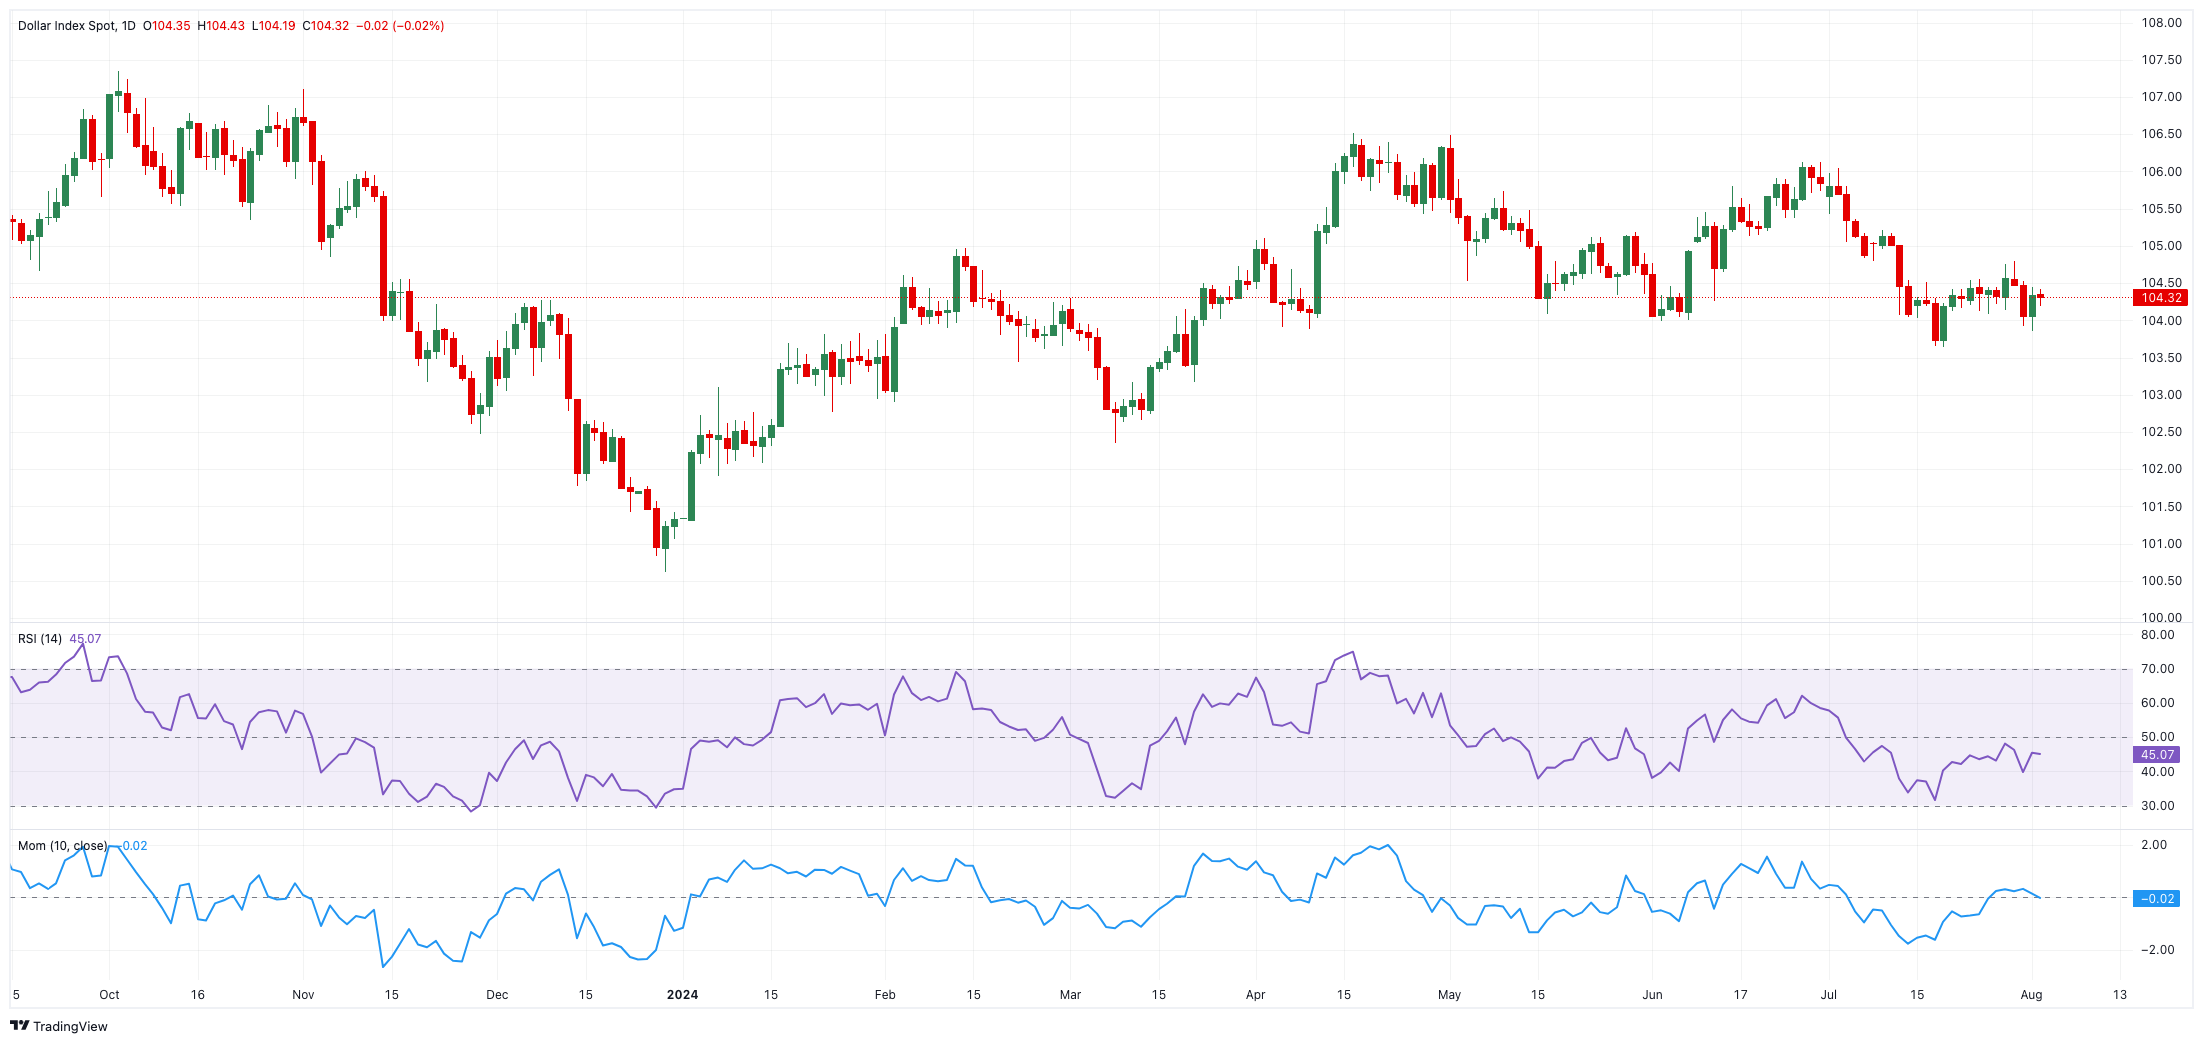
The US Dollar Index (DXY) maintains the trade well below the key 200-day Simple Moving Average (SMA) at 104.29. A convincing breakdown of this region should leave the index vulnerable to extra losses in the short-term horizon.
That said, initial support emerges at the weekly low of 103.38 (August 2), prior to the weekly low of 103.17 (March 21) and the March bottom of 102.35 (March 8).
Bouts of strength, on the other hand, face an interim barrier at the 55-day and 100-day SMAs at 104.83 and 104.91, respectively, ahead of the June top of 106.13 (June 26). Once the latter is cleared, DXY could attempt a move to the 2024 peak of 106.51 (April 16).
US Dollar PRICE Today
The table below shows the percentage change of US Dollar (USD) against listed major currencies today. US Dollar was the strongest against the Canadian Dollar.
| USD | EUR | GBP | JPY | CAD | AUD | NZD | CHF | |
|---|---|---|---|---|---|---|---|---|
| USD | -0.93% | -0.61% | -0.92% | -0.21% | -0.56% | -0.48% | -0.80% | |
| EUR | 0.93% | 0.31% | 0.03% | 0.71% | 0.37% | 0.44% | 0.13% | |
| GBP | 0.61% | -0.31% | -0.30% | 0.41% | 0.04% | 0.15% | -0.17% | |
| JPY | 0.92% | -0.03% | 0.30% | 0.72% | 0.36% | 0.43% | 0.13% | |
| CAD | 0.21% | -0.71% | -0.41% | -0.72% | -0.34% | -0.25% | -0.57% | |
| AUD | 0.56% | -0.37% | -0.04% | -0.36% | 0.34% | 0.10% | -0.24% | |
| NZD | 0.48% | -0.44% | -0.15% | -0.43% | 0.25% | -0.10% | -0.29% | |
| CHF | 0.80% | -0.13% | 0.17% | -0.13% | 0.57% | 0.24% | 0.29% |
The heat map shows percentage changes of major currencies against each other. The base currency is picked from the left column, while the quote currency is picked from the top row. For example, if you pick the US Dollar from the left column and move along the horizontal line to the Japanese Yen, the percentage change displayed in the box will represent USD (base)/JPY (quote).
Author

Pablo Piovano
FXStreet
Born and bred in Argentina, Pablo has been carrying on with his passion for FX markets and trading since his first college years.


