United Health Group Inc.(UNH) Elliott Wave technical analysis [Video]
![United Health Group Inc.(UNH) Elliott Wave technical analysis [Video]](https://editorial.fxstreet.com/images/Markets/Equities/Industries/Transportation/goods-train-637435358066371311.jpg)
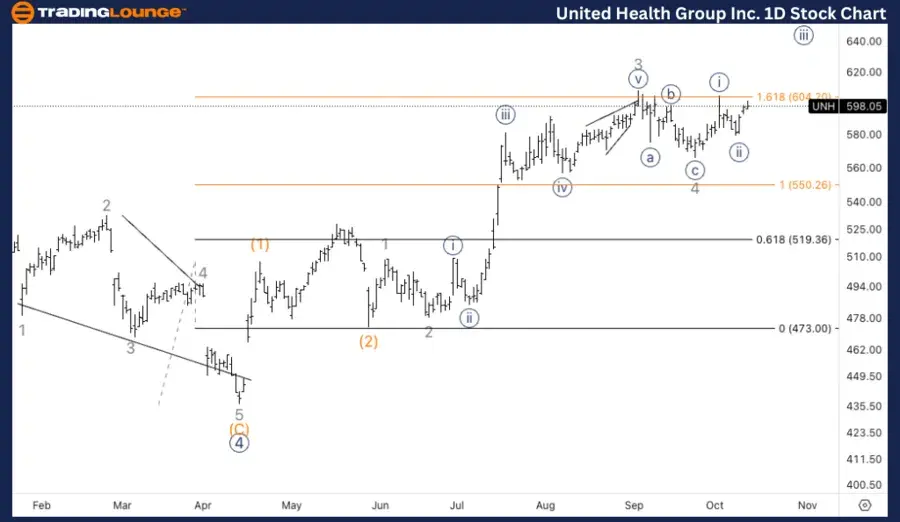
UNH Elliott Wave Analysis Trading Lounge Daily Chart,
United Health Group Inc.,(UNH) Daily Chart
UNH Elliott Wave technical analysis
Function: Trend.
Mode: Impulsive.
Structure: Motive.
Position: Minor wave 5.
Direction: Upside within wave 3.
Details: Looking for a bottom in wave 4 to be in place or near completion and consequently further upside towards MediumLevel at 650$.
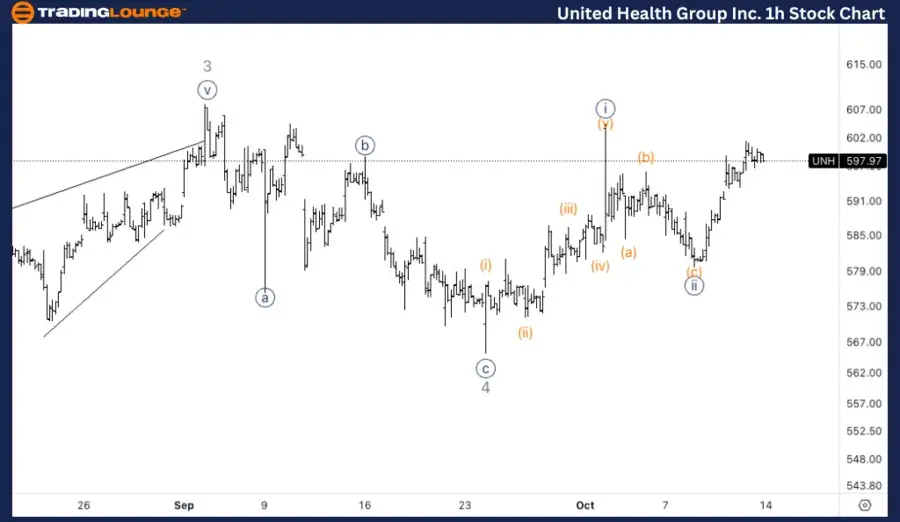
United Health Group Inc., (UNH) 1H Chart
UNH Elliott Wave technical analysis
Function: Trend.
Mode: Impulsive.
Structure: Motive.
Position: Minute wave {iii}.
Direction: Upside in wave {iii}.
Details: Looking for a potential {i}-{ii} completed within wave 5 as I can identify five waves within {i}. We now need tested support on top of 600$.
This Elliott Wave analysis for United Health Group Inc., (UNH) examines both the daily and 1-hour charts to assess its current market trend, utilizing Elliott Wave Theory to anticipate potential future movements.
UNH Elliott Wave technical analysis – Daily chart
On the daily chart, United Health Group (UNH) is completing or has nearly completed wave 4, suggesting that the next upward move in Minor wave 5 is approaching. This upward movement is expected to target the MediumLevel at $650. The correction in wave 4 appears to be finishing, and once confirmed, the continuation of the uptrend towards higher levels can be anticipated.
UNH Elliott Wave technical analysis – One-hour chart
On the 1-hour chart, UNH seems to have completed a five-wave move in wave {i} of Minor wave 5. Currently, wave {ii} might be in progress, and once a solid support level above $600 is established, the stock should resume its upward movement into wave {iii}. Testing this support zone will be crucial for confirming the next leg higher.
Technical analyst: Alessio Barretta.
UNH Elliott Wave technical analysis [Video]
Author

Peter Mathers
TradingLounge
Peter Mathers started actively trading in 1982. He began his career at Hoei and Shoin, a Japanese futures trading company.


