Transurban Group (TCL) Elliott Wave technical forecast [Video]
![Transurban Group (TCL) Elliott Wave technical forecast [Video]](https://editorial.fxstreet.com/images/TechnicalAnalysis/ChartPatterns/PointFigure/hand-of-business-man-write-a-business-graph-59591884_XtraLarge.jpg)
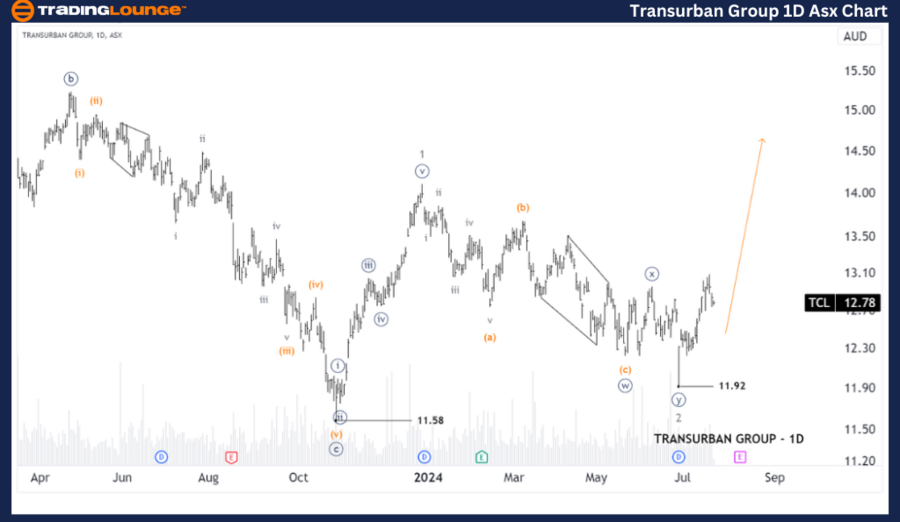
ASX: TCL Elliott Wave technical analysis
One-day chart analysis
Our Elliott Wave analysis today updates the Australian Stock Exchange (ASX) with TRANSURBAN GROUP (TCL). We observe TCL potentially bullish within the third wave of the third wave.
-
Function: Major trend (Minor degree, grey).
-
Mode: Motive.
-
Structure: Impulse.
-
Position: Wave 3 - grey.
-
Details: TCL has performed well since the last forecast. Since the low of 11.92, wave 3 - grey is unfolding to push higher. I will look for a Setup Long Trade after an ABC Correction is completed.
-
Invalidation point: 11.92
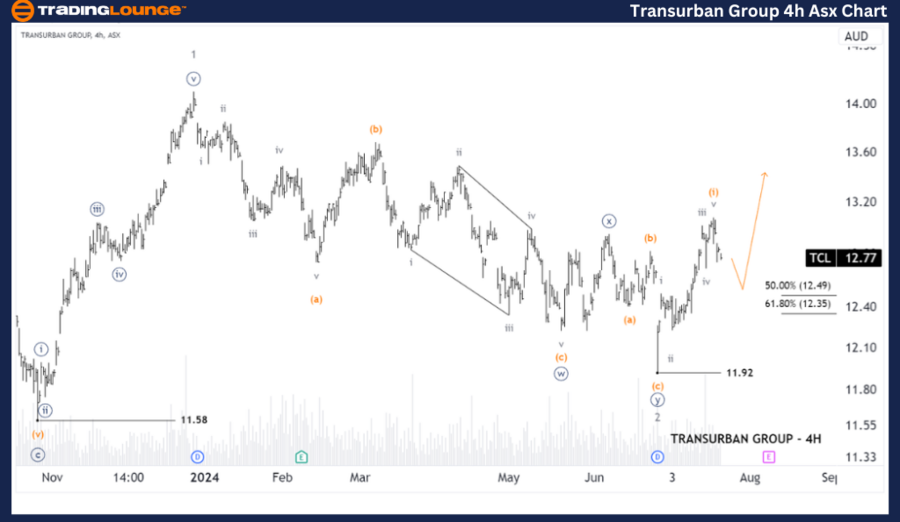
ASX: TCL Elliott Wave technical analysis
Four-hour chart analysis
-
Function: Major trend (Minuette degree, orange).
-
Mode: Motive.
-
Structure: Zigzag.
-
Position: Wave (ii) - orange.
-
Details: Since the 11.92 low, the (i) - orange wave opened and may have ended. Now, the (ii) - orange wave is unfolding to push lower, aiming for a target around 12.49 - 12.35. Wave (iii) - orange can then return to push higher. I will look for a Setup Long Trade after an ABC Correction is completed.
-
Invalidation point: 11.92.
Conclusion
Our analysis and forecast of contextual trends and short-term outlook for ASX: TRANSURBAN GROUP - TCL aim to provide readers with insights into current market trends and how to capitalize on them effectively. We offer specific price points that act as validation or invalidation signals for our wave count, enhancing the confidence in our perspective. By combining these factors, we strive to offer readers the most objective and professional perspective on market trends.
Transurban Group (TCL) Elliott Wave technical forecast [Video]
Author

Peter Mathers
TradingLounge
Peter Mathers started actively trading in 1982. He began his career at Hoei and Shoin, a Japanese futures trading company.


