|

TJX Companies (TJX) extends bullish sequence

TJX Companies, Inc., (TJX) operates as an off-price apparel & home fashions retailer in Unites States, Canada, Europe & Australia. It operates through four segments: Marmaxx, HomeGoods, TJX Canada & TJX International. It comes under Consumer Cyclical sector & trades as “TJX” ticker at NYSE.

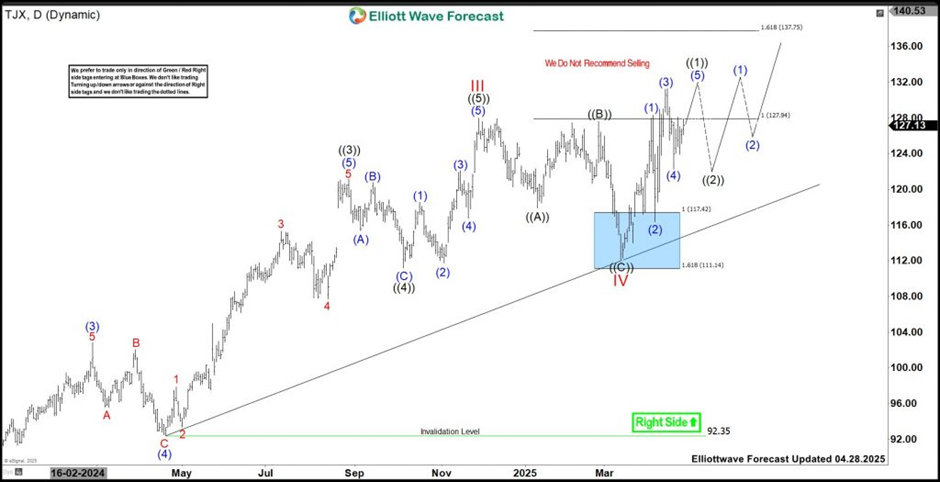
TJX favors rally as discussed in previous article, targeting $137 or higher levels in V of (III). Above 4.21.2025 low, it expects new high to finish the impulse from 4.07.2025 low.

TJX – Elliott Wave latest daily view 

Chart

In Weekly, it started ((III)) bullish sequence from March-2020 low of $32.72. It placed (I) impulse at $77.35 high & (II) at $53.69 low as 0.5 Fibonacci retracement in May-2022 low. Above there, it favors upside in (III) & expect rally to extend towards $128 or higher levels before (IV) pullback start. Within (III), it placed I at $64.84 high, II at $54.55 low, III at $128 high as extended wave, IV at $112.10 low & favors rally in V. Within III, it placed at ((1)) at $69.77 high, ((2)) at $59.78 low, ((3)) at $121.13 high, ((4)) at $111.22 low & ((5)) at $128 high.

TJX – Elliott Wave view from 3.24.2025 

Chart

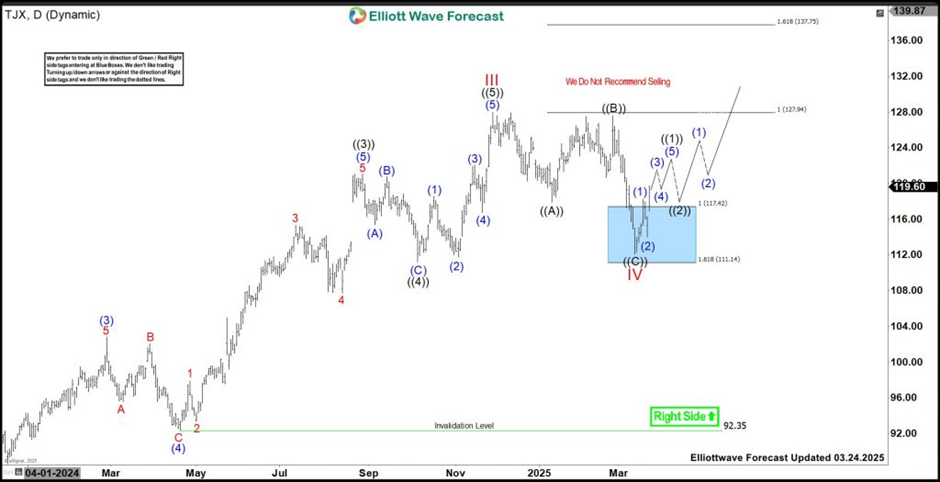
Above IV low of $112.10, it favors rally in ((1)) of V. So far, the structure appears overlapping diagonal in ((1)) of V. But if it manages to erase the momentum divergence in next rally, it can be nest in V. It placed (1) of ((1)) at $128.33 high, (2) at $116.37 low, (3) at $131.30 high & (4) at $122.25 low. It favors rally in (5) to finish ((1)) towards $133.41 – $136.86 area as the part of diagonal from 4.07.2025 low. Buyers from the blue box area are already having risk free long position. After finishing ((1)), it should pullback in 3, 7 or 11 swings against 4.07.2025 low, which remain supported at extreme area. We like to buy the pullback at extreme area.

Author

Elliott Wave Forecast Team

Elliott Wave Forecast Team

ElliottWave-Forecast.com

More from Elliott Wave Forecast Team
Share:

Editor's Picks

EUR/USD deflates to fresh lows, targets 1.1600

The selling pressure on EUR/USD now gathers extra pace, prompting the pair to hit fresh multi-week lows in the 1.1625-1.1620 band on Friday. The continuation of the downward bias comes in response to further gains in the US Dollar as market participants continue to assess the mixed release of US Nonfarm Payrolls in December.

GBP/USD breaks below 1.3400, challenges the 200-day SMA

GBP/USD remains under heavy fire and retreats for the fourth consecutive day on Friday. Indeed, Cable suffers the strong performance of the Greenback, intensified post-mixed NFP, and trades at shouting distance from its critical 200-day SMA near 1.3380.

Gold flirts with yearly tops around $4,500

Gold keeps its positive bias on Friday, adding to Thursday’s advance and challenging yearly highs in the $4,500 region per troy ounce. The risk-off sentiment favours the yellow metal despite the firmer tone in the Greenback and rising US Treasury yields.

Crypto Today: Bitcoin, Ethereum, XRP risk further decline as market fear persists amid slowing demand

Bitcoin holds $90,000 but stays below the 50-day EMA as institutional demand wanes. Ethereum steadies above $3,000 but remains structurally weak due to ETF outflows. XRP ETFs resume inflows, but the price struggles to gain ground above key support.

Week ahead – US CPI might challenge the geopolitics-boosted Dollar

Geopolitics may try to steal the limelight from US data. A possible US Supreme Court ruling on tariffs could dictate market movements. A crammed data calendar next week, US CPI comes on Tuesday; Fedspeak to intensify.

XRP trades under pressure amid weak retail demand

XRP presses down on the 50-day EMA support as risk-averse sentiment spreads despite a positive start to 2026. XRP faces declining retail demand, as reflected in futures Open Interest, which has fallen to $4.15 billion.