The Walt Disney Co. (DIS) Elliott Wave technical analysis [Video]
![The Walt Disney Co. (DIS) Elliott Wave technical analysis [Video]](https://editorial.fxsstatic.com/images/i/Computer-with-Chart_2_XtraLarge.png)
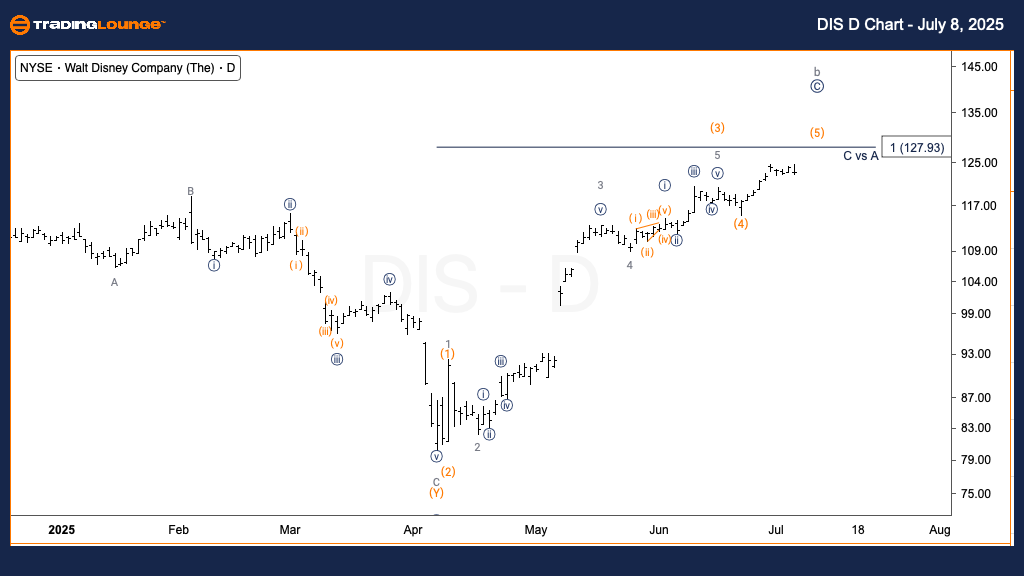
DIS Elliott Wave technical analysis – Daily chart
Function: Trend.
Mode: Impulsive.
Structure: Motive.
Position: Wave (5) of C.
Direction: Top in Wave (5).
Details:
The uptrend that began from the April 7th low appears to be nearing completion. The equality of Primary Wave C with Wave A targets the $128 level.
On the daily timeframe, The Walt Disney Co. (DIS) is in the late stages of a corrective rally, forming wave (5) of C. The move has developed in a motive structure, rising from April 7th lows. With wave C nearing equivalence to wave A at $128, this price zone is critical for identifying a potential market top. If wave (5) completes around this area, it may mark the end of the corrective cycle and signal a directional shift.
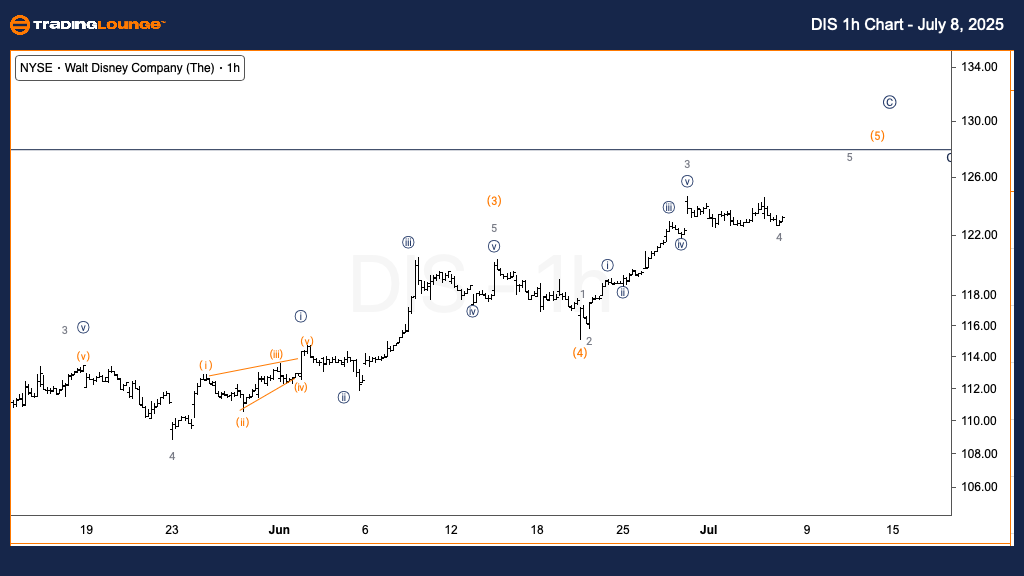
DIS Elliott Wave technical analysis – One-hour chart
Function: Trend.
Mode: Impulsive.
Structure: Motive.
Position: Wave 4 of (5).
Direction: Upside in Wave 5.
Details:
Wave 4 of (5) is underway, with expectations of one more leg up into wave 5 of (5).
A bullish alternative also suggests this structure could be part of wave 1 and 2 of a new impulsive trend.
The 1-hour chart for DIS supports a continuation of the uptrend, with wave 4 of (5) nearly complete. A final leg into wave 5 of (5) is anticipated. This would finish the larger corrective wave C. However, an alternative count hints at the formation of waves 1 and 2 within a new primary impulsive trend. If the bullish count plays out, prices may push significantly above current levels, challenging key resistance zones.
Traders should monitor closely near the $128 resistance level for potential reversal signals or confirmation of continued bullish strength.
The Walt Disney Co. (DIS) Elliott Wave technical analysis [Video]
Author

Peter Mathers
TradingLounge
Peter Mathers started actively trading in 1982. He began his career at Hoei and Shoin, a Japanese futures trading company.


