The longer term swings and bullish cycles of $BEL20

1st the BEL20 Index has trended higher with other world indices since the benchmark was established. The index remained in a long term bullish trend cycle into the May 2007 highs. From there it made a sharp correction lower that lasted until March 2009 similar to other world indices. That is where the index corrected the whole long term bullish cycle from the all time lows. At this point is where this bullish trend, cycle and swing analysis begins.
Secondly, the 2009 lows corrected the whole longer-term cycle higher from inception in the benchmark index. The bounce from the March 2009 lows into the January 2018 highs was a clear five swing impulse. The pullback lower from that high is strong enough to suggest it is correcting the whole cycle up from the March 2009 lows. This is determined by reading the RSI and other momentum indicators. The analysis continues below the monthly chart.
BEL20 monthly chart
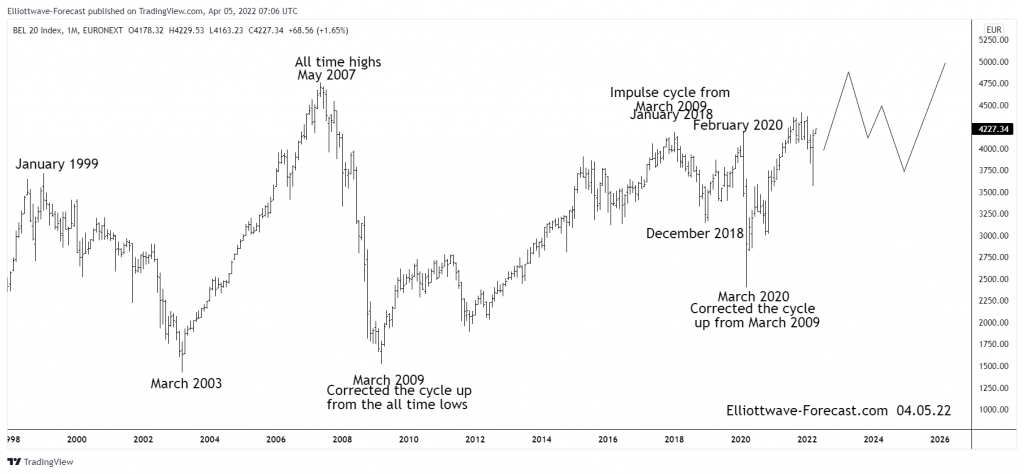
Thirdly, previously mentioned earlier, the pullback from January 2018 high to the December 2018 lows was strong enough to suggest it is correcting the cycle up from the March 2009 lows. At this point the index could have possibly completed a corrective sequence against the uptrend however some related instruments suggested an otherwise deeper pullback. In February 2020 it did the next swing lower into the March 2020 lows which appeared to have completed an expanded flat from the January 2018 highs.
In conclusion, this expanded flat is a typical and common Elliott Wave corrective structure. Previously mentioned earlier, this corrected the cycle from the 2009 low. At this point in time from the March 2020 lows it appears the index has ended a third wave. Ideally while pullbacks remain above the March 2022 lows the index can see another high before it corrects the cycle from the March 2020 lows. While above there it is expected to resume the longer-term bullish trend higher back above the May 2007 highs.
Author

Elliott Wave Forecast Team
ElliottWave-Forecast.com


