|

The key trendline to watch on Internet Computer

Internet Computer Protocol (ICP) is a cryptocurrency that remains well off its prior highs, and the drawdown has been significant. From its highs in November, ICP is down over 76%. From the highs earlier this year, it is down more than 52%. Those are meaningful declines by any standard, and they have kept ICP firmly under pressure for months.

In my view, much of this downside was driven by the broader weakness in the cryptocurrency market, particularly the decline in Bitcoin’s price. When Bitcoin pulls back sharply, it tends to drag the rest of the market with it, and ICP was no exception. As Bitcoin sold off, risk appetite across crypto faded, and ICP followed suit.

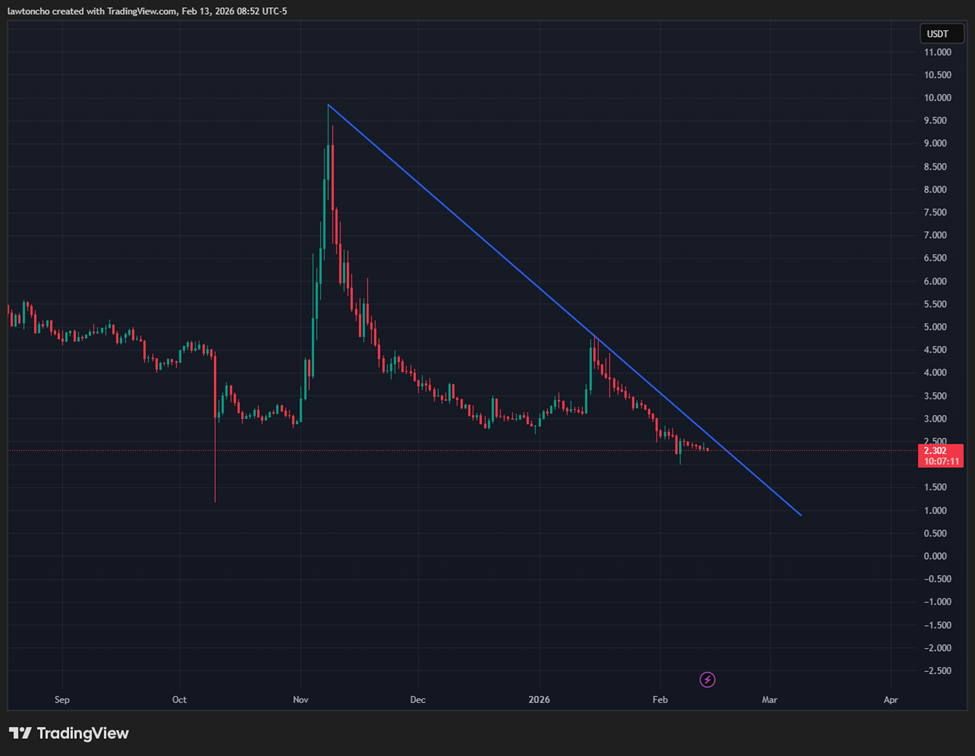
Despite the magnitude of the pullback, I am now focused less on what ICP has done and more on what it could do next from a technicals standpoint. There is a key trendline that I am actively watching for a potential shift in momentum. This trendline can be drawn from the highs in November down to the highs made last month, and it has acted as a clear point of technical resistance.

If ICP is able to break up and above this trendline, it could signal a meaningful change in direction. A confirmed move through that level would suggest that sellers are losing control and that buyers are beginning to step back in. From a technical analysis perspective, this kind of break has the potential to open the door to explosive upside, especially given how extended the prior decline has been.

For those less familiar with ICP, Internet Computer is a cryptocurrency that has experienced extreme volatility since its peak, making it a name that demands close attention to price structure and trend behavior. Its sharp moves both higher and lower highlight why technical analysis and disciplined execution matter when trading assets like this.

I always approach situations like this with patience and respect for risk. No matter how compelling a chart may look, proper risk management is essential when trading cryptocurrency. I am watching this trendline closely, but I will always let price action confirm the thesis before acting.

Author

Lawton Ho

Lawton Ho

Verified Investing

A marketing expert sharing his journey to mastering the charts.

More from Lawton Ho
Share:

Editor's Picks

AUD/USD stays bid above 0.7100 on Australian trade data, Mideast optimism

AUD/USD clings to minor recovery gains above 0.7100 in the Asian session on Thursday as a new Israel-Lebanon ceasefire keeps a lid on the safe-haven US Dollar. Meanwhile, strong AustralianTrade Balane data also help the Aussie pair sustain the bounce from weekly lows.

USD/JPY hovers near the 160.00 intervention threshold on Mideast tensions

USD/JPY struggles to find acceptance above 160.00 and retreats from a one-month high in the Asian session on Thursday amid fears that authorities will step in again to prop up the Japanese Yen. Furthermore, a new Israel-Lebanon ceasefire caps the US Dollar and supports the currency pair. However, renewed US-Iran tensions keep the downside limited in the Greenback and the pair.

Gold defends 200-day SMA; upside seems capped on Iran uncertainty

Gold recovers from a one-week low near $4,425, or the 200-day SMA, in the Asian session on Thursday, as news of an Israel-Lebanon ceasefire acts as a headwind for the safe-haven US Dollar. However, renewed hostilities in the Gulf, along with stalled US-Iran peace talks, keep geopolitical risks in play and should support the USD, checking the Gold price rebound.


XRP and XLM outlook: Bearish streak extends as risk-off mood erodes retail demand, ETF flows

Ripple and Stellar prices face intense selling pressure, extending losses on Thursday for the fourth consecutive day this week. Cross-border remittance tokens are losing retail sentiment, while XRP faces additional pressure from Exchange-Traded Fund outflows.

Kevin Warsh takes the Fed helm: What it means for the US Dollar
The Federal Reserve moves away from the highly predictable "forward guidance" model of the Jerome Powell era to a new “Kevin Warsh environment”, characterized by less communication, more policy surprises, and an increased focus on the Fed's complex balance sheet.
Recession on paper: What really moves the Canadian Loonie now?

Statistics Canada handed the headline writers a gift and the analysts a headache. Real GDP shrank 0.1% on an annualized basis in the first quarter, and with the fourth quarter of 2025 revised down to a 1.0% contraction, that is two negative quarters in a row, the textbook definition of a technical recession and Canada's first since the pandemic.