The inverse head and shoulders pattern to watch on Lennar Corporation

Lennar Corporation (LEN) had a strong session today, finishing the day up over 8.5% from yesterday’s close. The stock moved higher on news surrounding President Trump’s mortgage bond plan, which acted as a clear catalyst for today’s price action. When I look at moves like this, I always start by stepping back and evaluating the technicals, especially when a stock reacts this decisively to news.
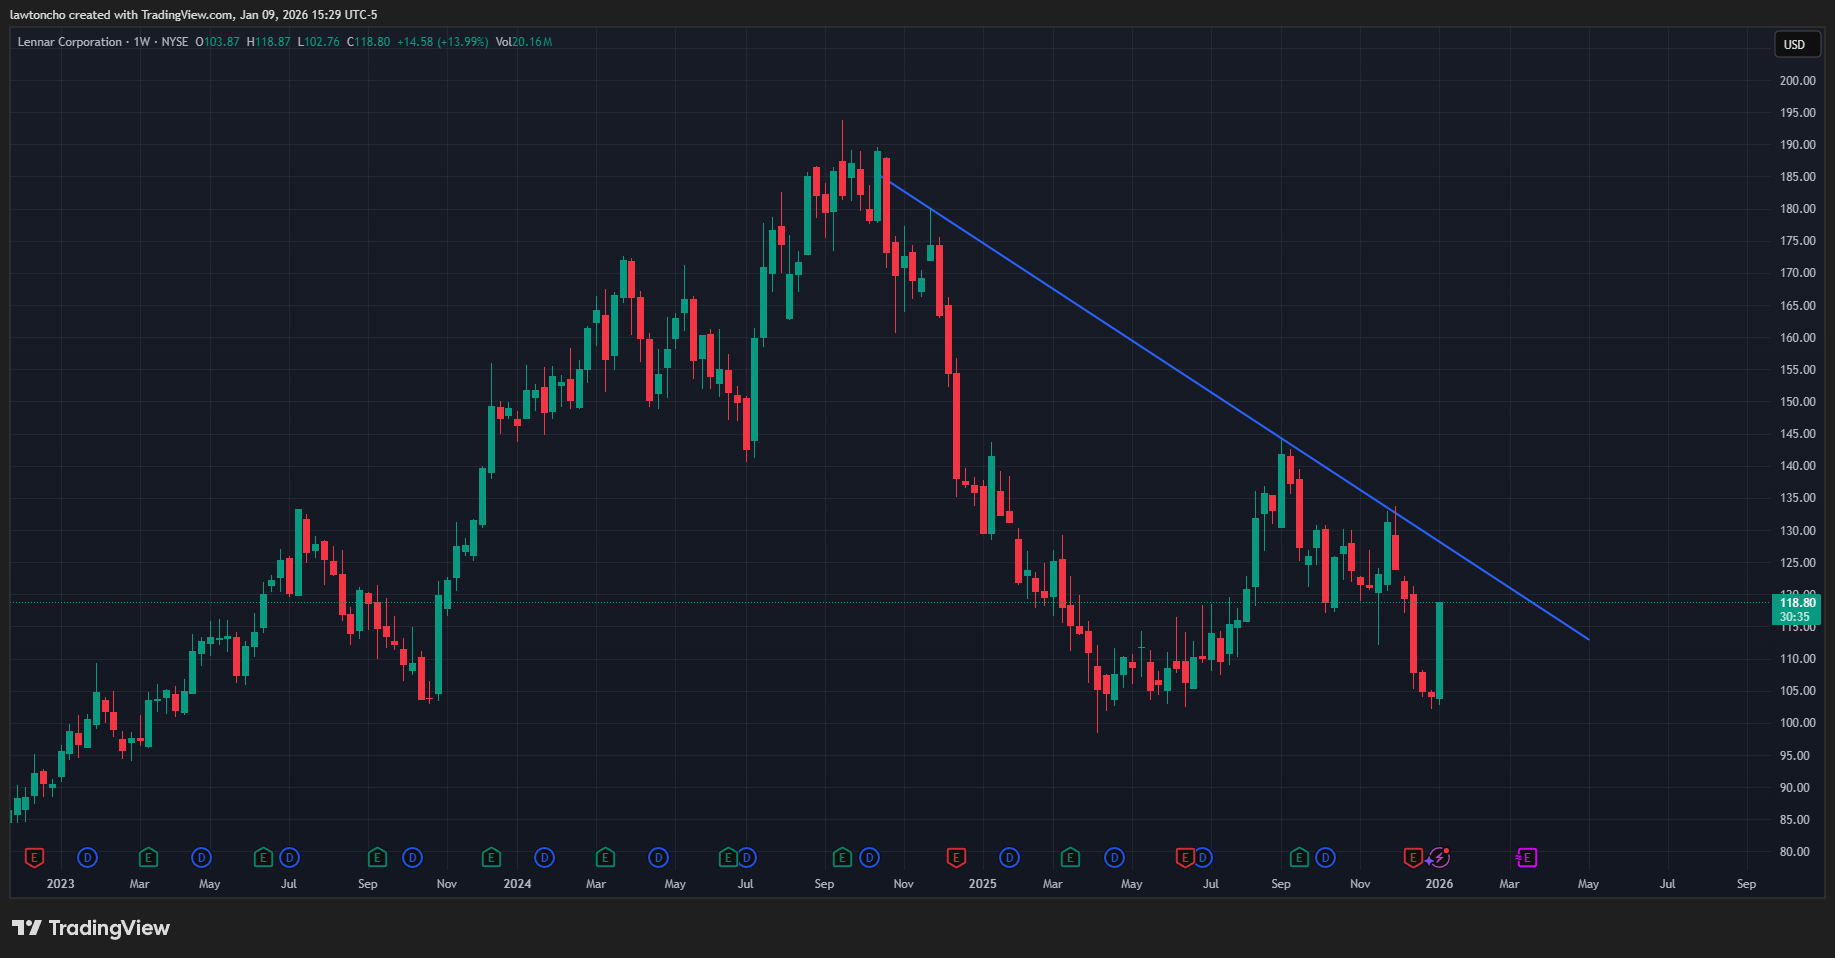
On the daily chart, Lennar has formed what I view as a textbook inverse head and shoulders pattern. This is an extremely bullish technical formation and one I pay close attention to when it appears on higher timeframes. Patterns like this reflect a potential shift in market sentiment, and in this case, the structure has been developing over an extended period of time rather than forming impulsively.
The neckline of this inverse head and shoulders can be drawn by connecting several key price points. Specifically, it begins with the stock’s price action on October 18, 2024, extends through the highs from October 25 of that same year, continues through the highs from September of last year, and carries forward to the highs printed in November of last year. When I map this out on the chart, the neckline becomes very clear and well-defined, which is something I look for when assessing the quality of a pattern.
If price is able to break and hold above this neckline, the measured move associated with the inverse head and shoulders would suggest upside potential of more than 50%. I want to emphasize that this projected move is purely based on the structure of the pattern itself and the standard measured move principles tied to this setup. From a technicals perspective, this is exactly why this pattern stands out to me right now.
Before discussing the chart further, it’s also important to briefly touch on the company itself. Lennar Corporation is one of the largest homebuilders in the United States, with operations focused on the construction and sale of residential properties. The company has a long history in the housing industry and is widely followed by both institutional and retail market participants. Because of its size and role within the broader housing market, Lennar often becomes a focal point when macro-related housing news enters the market, which helps explain the attention on the stock during sessions like today.
Even with a bullish technical structure in place, I always remind myself that no pattern is guaranteed. While the inverse head and shoulders is a powerful formation, confirmation matters, and price behavior around the neckline is key. This is where discipline becomes just as important as analysis.
As always, proper risk management should be a priority when trading stocks. No matter how compelling the technicals may appear, protecting capital and managing downside risk remains essential. Patterns can fail, volatility can increase, and markets can always surprise you, which is why I approach every setup with both confidence and caution.
Author

Lawton Ho
Verified Investing
A marketing expert sharing his journey to mastering the charts.


