The Elliott Wave explains how the SP500 can reach 7120

In our previous update for the SP500 (SPX), we shared our big-picture Elliott Wave (EW) Principle count and concluded that
“…, the index is now in orange W[AVE]-5, ideally reaching the 200.0% extension around 6560. ... Once the gray W-iii completes, barring any unforeseen extensions, we should see the gray W-iv decline to the 123.6-100.0% extension zone (6335-6190), followed by a W-v to its own 200.0% extension level at approximately 6800, and so on. We don’t see a major top until the black W-3 completes at possibly as high as 7120, which could happen in the Spring of 2026, based on the Armstrong Pi turn date. Meanwhile, the gray iii, iv, and the green 3, 4, 5 tops and bottoms could be excellent opportunities for swing traders.”
In today’s update, we shift our focus back to the short-term as the index continues to look promising. See Figure 1 below. Here, we use daily closing prices to identify the waves. This approach reduces noise, making wave counting easier due to fewer interpretive issues: down days are often the 2nd and 4th waves in a bull run. By combining this quantitative method with classic EW, we can explain over 99% of all daily price action.
Figure 1. Our preferred short-term Elliott Wave count
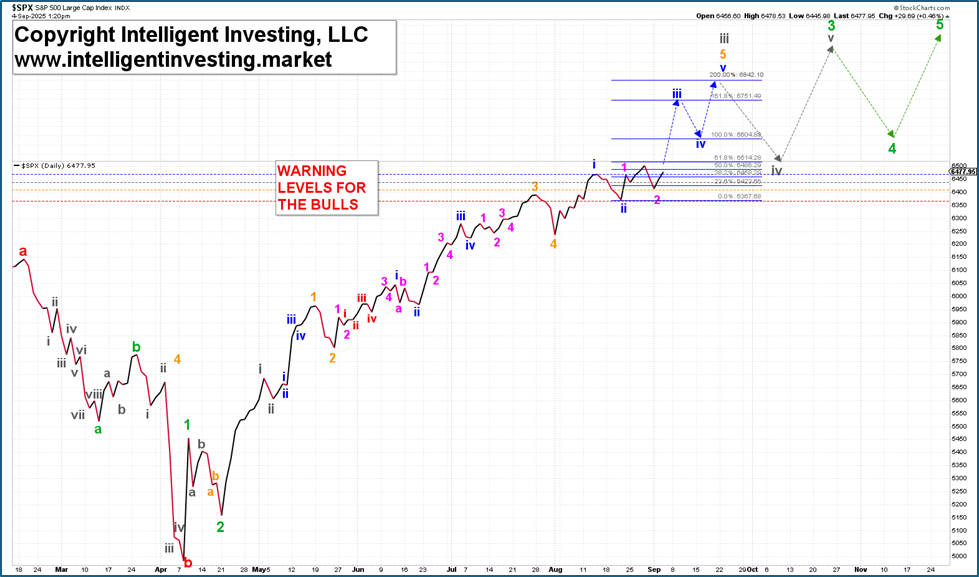
Thus, it appears the orange W-5 mentioned in our previous update is subdividing and, therefore, possibly extending. With this wave count, an ideal target of ~6840 can be on tap for the gray W-iii. This will also mean the green W-5 will reach the 7120 level. Current warning levels for the Bulls are set at: 6466, 6439, 6415, and 6370 for this wave count. We will adjust these levels for our premium newsletter members as the markets progress, providing us with any early indication that 6840 may not be reached.
Namely, we can also evaluate the SPX’s price action as having completed an irregular running flat gray W-iv. See the black circle in Figure 2 below. It would indicate that the index is now in the gray W-v, which is a step ahead of the EW count shown in Figure 1. The ideal upside target for the current rally is then 6690+/-10, which is where the gray 200.00% and green 276.40% extensions overlap; 6687 vs 6690, respectively.
Figure 2. The daily chart with our alternative EW count
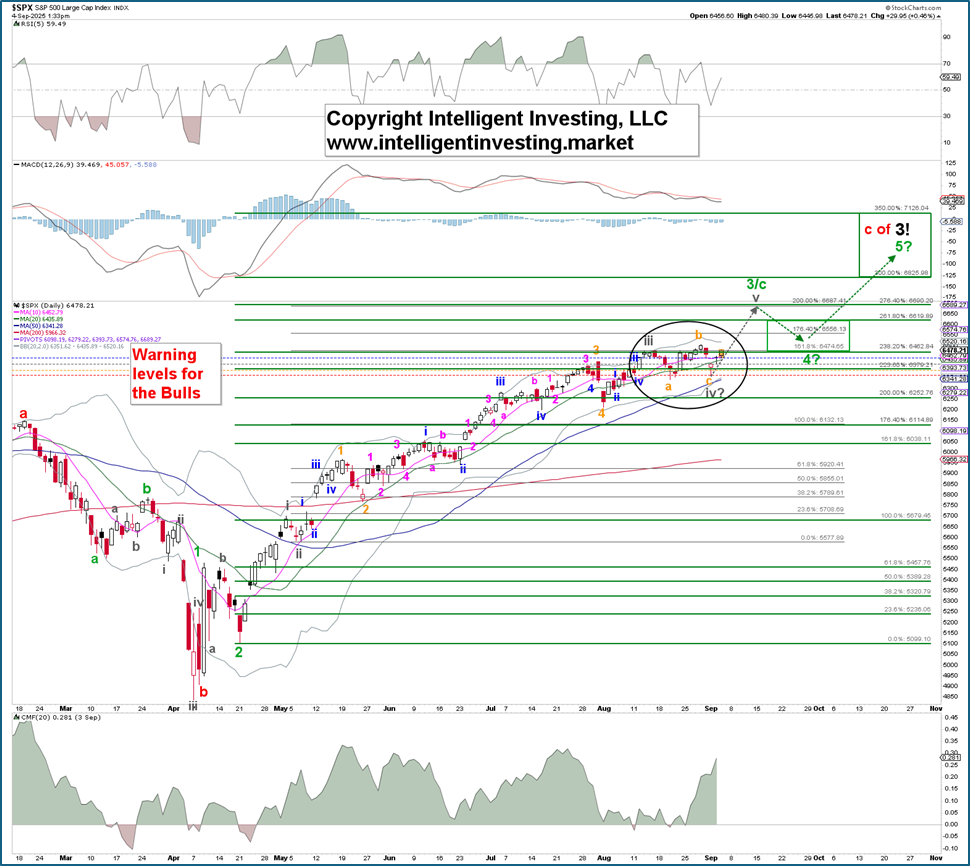
From there, a mild 4±1% pullback (green W-4?) can be expected before the green W-5 rallies the price to, ideally, the 350% extension at 7126. The latter overlaps exactly with that of the now infamous 7120 level. The warning levels for this wave count are currently set at: first at 6445 (25% chance that the gray W-iv is not over); second at 6416 (50% chance the gray W-iv is not over); third at 6384 (75% chance the gray W-iv is not over); fourth at 6360 (W-iv is certainly not over).
Therefore, with two wave counts indicating the same upside target, 7120, we should expect pullbacks, like Tuesday's, in the coming weeks or months as low-risk opportunities for swing trades. Now, it's just a matter of monitoring to see which of the two proves more effective in explaining the SPX’s price action. That’s a fortunate problem to have.
Author

Dr. Arnout Ter Schure
Intelligent Investing, LLC
After having worked for over ten years within the field of energy and the environment, Dr.


