The Coca-Cola Company (KO) Elliott Wave technical analysis [Video]
![The Coca-Cola Company (KO) Elliott Wave technical analysis [Video]](https://editorial.fxstreet.com/images/Markets/Equities/Industries/Food/water-bottles_XtraLarge.jpg)
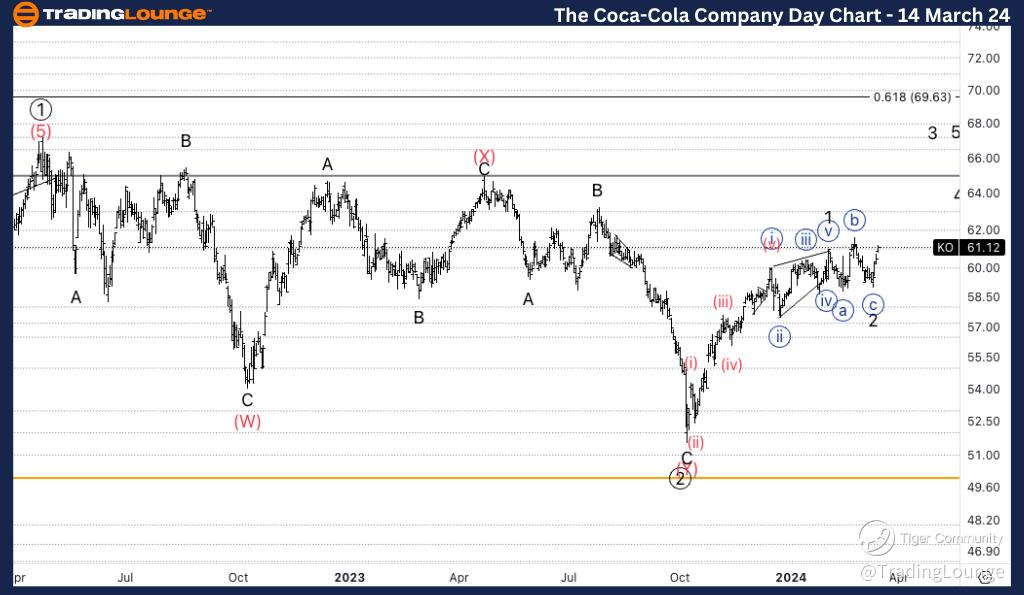
KO Elliott Wave technical analysis
Function: Trend.
Mode: Impulsive.
Structure: Motive.
Position: Wave (1) of Primary 3.
Direction: Upside into wave 3 of (1).
Details: We are looking for further upside into wave 3 as we have yet to take the highs of wave (X) out, to give us additional confirmation.
KO Elliott Wave technical analysis – Daily chart
In our analysis, we identify a trending function characterized by impulsive mode and motive structure. Positioned in Wave (1) of Primary 3, our focus is on the upside movement into wave 3 of (1). We anticipate further upward momentum, aiming to surpass the highs of wave (X) to provide additional confirmation of the bullish trend.
KO Elliott Wave technical analysis
Function: Trend.
Mode: Impulsive.
Structure: Motive.
Position: Wave {i} of 3.
Direction: Upside into wave 3.
Details: Looking for a break of wave {b} to have additional confirmation wave 2 if complete. We are seeing increasing volume on this move up from wave {c} bottom which confirms the bulls case.
KO Elliott Wave technical analysis – Four hour chart
Here, we also observe a trending function marked by impulsive mode and motive structure. Positioned in Wave {i} of 3, our attention is on the upside movement into wave 3. We anticipate a break of wave {b} to confirm the completion of wave 2. Notably, the increasing volume accompanying the upward movement from wave {c} bottom strengthens the bullish case.

KO Elliott Wave technical analysis [Video]
Author

Peter Mathers
TradingLounge
Peter Mathers started actively trading in 1982. He began his career at Hoei and Shoin, a Japanese futures trading company.


