The Boeing Company (BA) Elliott Wave technical analysis [Video]
![The Boeing Company (BA) Elliott Wave technical analysis [Video]](https://editorial.fxsstatic.com/images/i/stock-02_XtraLarge.jpg)
BA Elliott Wave technical analysis – Daily chart
Function: Trend.
Mode: Impulsive.
Structure: Motive.
Position: Wave {i} of 3.
Direction: Upside in Wave {i}.
Details: Wave 2 may have bottomed earlier than expected, as current price action continues to rise within an impulsive structure.
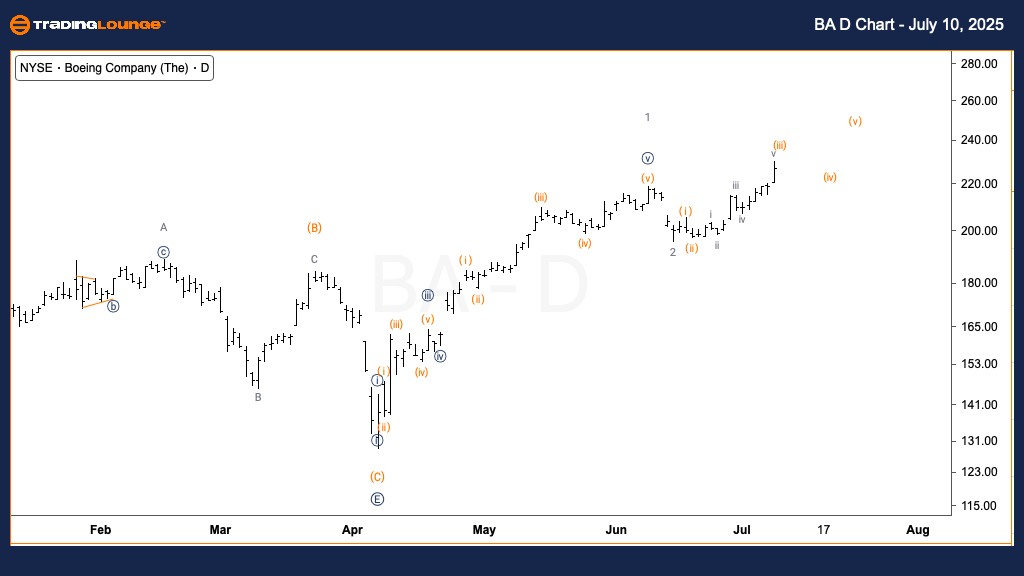
Daily chart overview
The daily Elliott Wave analysis for The Boeing Company (BA) reflects a shift toward a bullish trend. Market movements indicate wave 2 might have concluded ahead of previous expectations, with the stock now pushing higher within wave {i} of 3. This new development marks the beginning of a possible large-scale impulsive rally. The pattern forming supports a motive wave, suggesting a strong upside with increasing momentum.
BA Elliott Wave technical analysis – One-hour chart
Function: Trend.
Mode: Impulsive.
Structure: Motive.
Position: Wave v of (iii).
Direction: Upside in Wave v.
Details: Wave v is extending higher, moving toward the $230 level—a significant area within MinorGroup1.
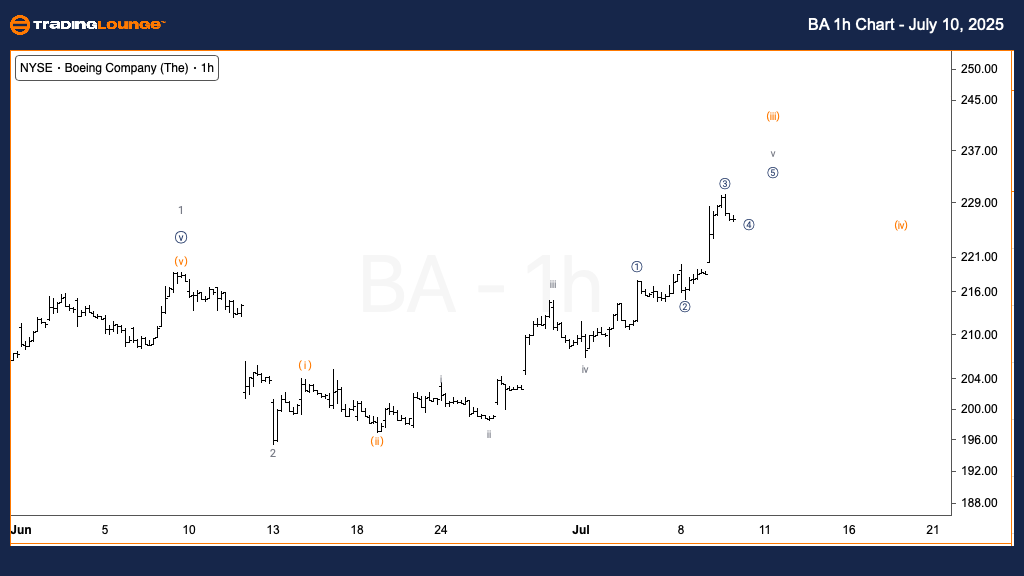
One-hour chart analysis
The 1-hour chart provides more granular insight into the stock's short-term direction. BA is currently advancing in wave v of (iii), with price action approaching the key resistance zone at $230. This movement is a continuation of an active bullish sequence, indicating the end of MinorGroup1 may be near. Traders should pay close attention to price action near this level, as it may signal a short-term top followed by a corrective wave (iv) pullback. Impulsive behavior supports the trend, but caution is warranted as the rally matures.
Summary
This technical analysis using Elliott Wave principles reveals that Boeing is currently in an impulsive upward phase across both daily and intraday timeframes. The price structure supports a continuation of the uptrend, with wave {i} of 3 underway on the daily chart and wave v of (iii) nearing its peak on the 1H chart. Monitoring the $230 level will be critical for identifying potential turning points or continuations.
The Boeing Company (BA) Elliott Wave technical analysis [Video]
Author

Peter Mathers
TradingLounge
Peter Mathers started actively trading in 1982. He began his career at Hoei and Shoin, a Japanese futures trading company.


