The bearish pattern to watch on ConocoPhillips

ConocoPhillips (COP) had a solid session yesterday, finishing the regular trading day up over 1%. The stock has shown respectable strength since putting in its recent lows on November 25th, rallying more than 13.5% off that level. From a surface-level perspective, that kind of move can look encouraging, especially for traders who caught the bounce early. However, when I step back and focus on the technicals, the structure developing on the daily chart is worth paying close attention to.
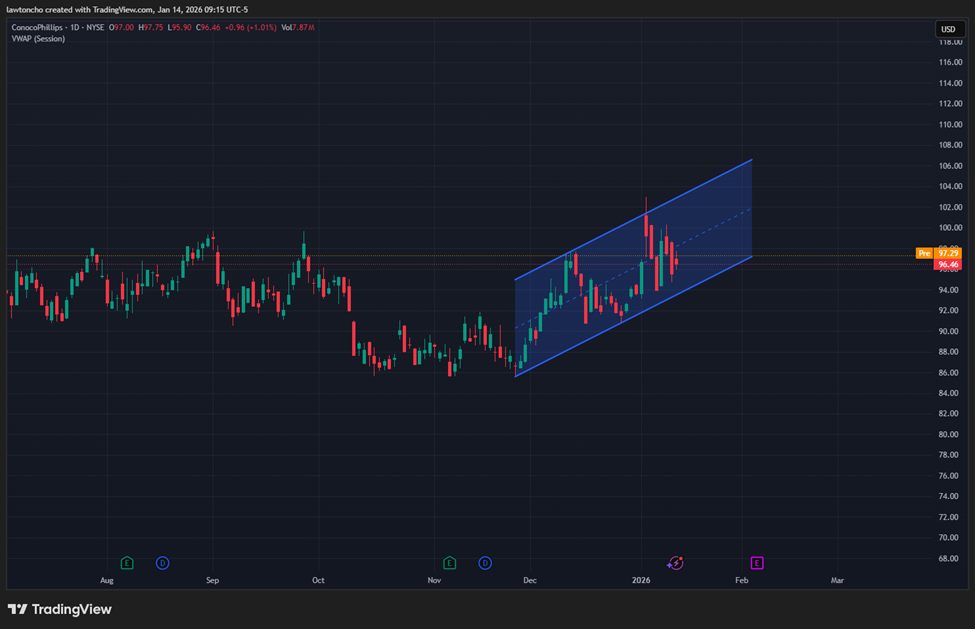
Since those late-November lows, COP has been climbing within a clearly defined upsloping parallel channel. While rising price action often feels bullish, this specific pattern can be deceptive. On the daily timeframe, an upsloping channel after a sharp bounce can signal weakening momentum beneath the surface. In this case, price is moving higher, but it’s doing so in a controlled, narrowing structure that often precedes a breakdown rather than a continuation.
From a technical standpoint, the key level I am watching is the lower boundary of that upsloping channel. Should COP break below the bottom trendline, I am anticipating further downside from there. That break would represent a failure of the current structure and would suggest that the recent rally may be running out of steam. This is one of those situations where the technicals can shift quickly, and I want to be prepared if that support gives way.
For traders looking to participate, I see two primary approaches based on the pattern itself. The first is entering on a clean break of the lower trendline, allowing the market to confirm that the structure has failed. The second option is waiting patiently for a retrace back toward the bottom of the parallel channel and using that area as a potential entry, assuming price action cooperates. In either case, the focus for me remains on respecting the structure and letting the chart dictate the trade rather than forcing one.
As a bit of background, COP has been actively trading within this defined range since late November, and the current move higher is still occurring within that same technical framework. The stock’s recent performance, including yesterday’s green session and the broader bounce from the November 25th lows, is precisely what makes this pattern so important to monitor. The trend may appear constructive on the surface, but the structure itself is what ultimately matters.
As always, regardless of direction or conviction, proper risk management is essential. No pattern is guaranteed to resolve as expected, and I always make sure my risk is clearly defined before entering any trade. Staying disciplined with position sizing and stops is just as important as identifying the setup in the first place.
Author

Lawton Ho
Verified Investing
A marketing expert sharing his journey to mastering the charts.


