|

The $77.88 line in the sand: Why Qorvo’s long-term bull case is at risk

Qorvo, Inc. (QRVO), a company in radio frequency and power management solutions, had a rough outing Wednesday. The semiconductor specialist to everything from smartphones and defense to automotive tech saw a sharp 7.52% decline, closing out the session at $81.50.

From a technical standpoint, the move on Wednesday is significant because it marks the failure of a daily bull flag pattern that had been developing throughout most of December. In the world of technical analysis, when a pattern fails, it generally leads to an aggressive move in the opposite direction. We are seeing that play out now, and the immediate concern is whether price can be saved at the first major support level of $77.88. If $77.88 fails to hold, the door opens for a deeper slide toward the next support at $71.17.

Daily chart

Chart

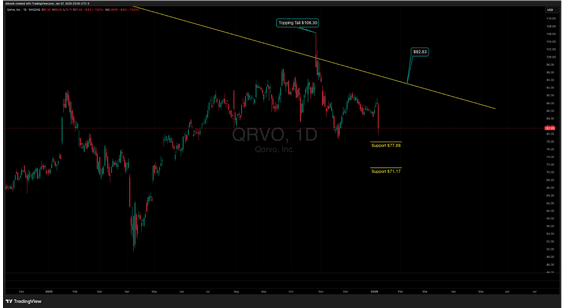
It is worth noting that this downside momentum was actually foreshadowed back on October 28th, 2025, by a daily topping tail. That specific candle pierced a long-term declining trendline that stretches all the way back to 2021. While the price action on Wednesday is bearish, there is a silver lining for the long-term view: the next time QRVO attempts to clear that 2021 trendline, it will be the 4th hit. Historically, each subsequent hit weakens a resistance line, increasing the probability of an eventual breakthrough.

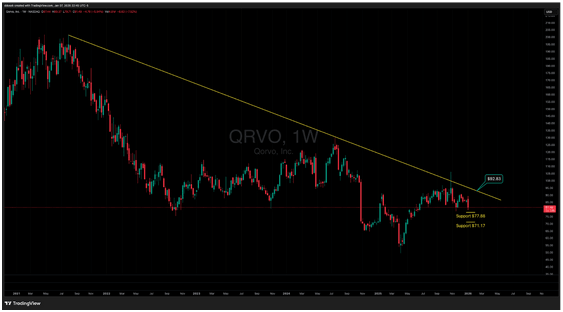
Looking at the weekly chart, the stock has been in a period of bullish consolidation since June 2025, all sitting just beneath that major declining trendline. This suggests that, despite today's drop, the stock has been building the energy necessary for a breakout. However, this makes the $77.88 support level even more critical; if price breaks below that mark, the entire bullish consolidation structure from June 2025 will be in jeopardy. Generally, longer-term patterns have more power. If this weekly pattern holds, QRVO could still be building momentum for a break through the declining trendline. 

Weekly chart

Chart

Author

Drew Dosek

Drew Dosek

Verified Investing

Passionate technical and cycle analyst committed to empowering traders through data-driven insights.

More from Drew Dosek
Share:

Editor's Picks

EUR/USD stays weak near 1.1650 ahead of critical US events

EUR/USD stays in the red near 1.1650 in the European trading hours on Friday. The pair remains undermined by broad US Dollar strength and a cautious market mood. Traders keenly await the US Nonfarm Payrolls data and Supreme Court's ruling on Trump's tariff powers for further direction. 

GBP/USD holds lower ground below 1.3450, with eyes on US data

GBP/USD remains subdued for the fourth consecutive day, while trading below 1.3450 in the European session on Friday. Markets remain in a wait-and-see mode before the key US event risks and prefer to hold the US Dollar, which weighs negatively on the pair. The US monthly jobs data and the Supreme Court decision on tariffs are awaited. 

Gold flat lines around $4,475; looks to US NFP report for fresh impetus

Gold reverses a modest intraday dip to the $4,453 area, and trades near the top end of its daily range heading into the European session. The upside, however, seems limited as traders might opt to wait for the US Nonfarm Payrolls report later today. The crucial employment details will be looked upon for more cues about the Federal Reserve's rate-cut path.

Nonfarm Payrolls expected to show US labor market remained weak in December

The United States Bureau of Labor Statistics will release the Nonfarm Payrolls data for December on Friday at 13:30 GMT. Economists expect Nonfarm Payrolls to rise by 60,000 in December following the 64,000 increase recorded in November.

2026 economic outlook: Clear skies but don’t unfasten your seatbelts yet

Most years fade into the background as soon as a new one starts. Not 2025: a year of epochal shifts, in which the macroeconomy was the dog that did not bark. What to expect in 2026? The shocks of 2025 will not be undone, but neither will they be repeated.

Pepe Price Forecast: PEPE risks 100-day EMA fallout as bullish interest fades

Pepe is under extreme selling pressure, trading in the red for the fifth consecutive day, down 1% at press time on Friday. Pepe’s decline following a 72% hike last week suggests a likely profit-booking phase, while on-chain data indicates declining network activity.