The 40-year signal: Why ConAgra (CAG) is the value trade of 2026

Ignore the headlines. Ignore the noise. If you want to know where the next major opportunity is, you look at the chart. The chart is the only thing that doesn't lie, and right now, ConAgra Brands (CAG) is flashing a technical setup that has been over four decades in the making.
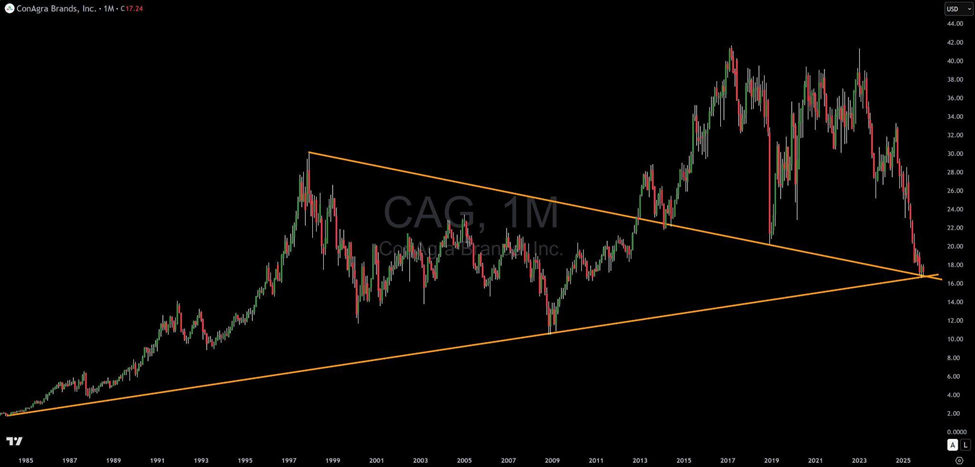
I’m looking at a massive convergence of trendlines here. This isn't just a daily or weekly level; this is structural.
First, we have an ascending trendline that starts all the way back at the 1982 lows. Think about that timeframe. This line held through the crash of ’87, the Dot-Com bust, and it connects perfectly through the 2008 financial crisis lows. That is your "line in the sand" for institutional support.
Second, look at the descending trendline coming off the 1997 cycle high. It cuts right through the major pivot lows of 2014 and 2018.
The Setup: These two massive trendlines extend out and merge exactly where the price is trading right now. This is a pinch point. In my experience, when price action gets squeezed into a multi-decade apex like this, a big move follows. The risk-reward here heavily favors the bulls. We are talking about buying at a level that has supported this stock through every recession since the early ‘80s.
The Fundamental Catalyst: Charts give us the entry, but fundamentals tell us the story. I ran a scan to see what backs up this technical recovery, and the data supports a bottom.
- Paid to Wait (8%+ Yield): While the technicals play out, you are collecting an approx. 8.1% dividend yield. In a market where everything else is overvalued, getting paid 8% to hold a defensive staple at structural support is a no-brainer for the patient investor.
- Supply Chain Turnaround: The company took a hit in 2025 due to supply chain issues, specifically in chicken production. That is in the rear-view mirror. As these one-off shocks fade, volume growth is projected to return in the second half of fiscal 2026.
- Guidance Floor: Management reaffirmed fiscal 2026 guidance (EPS $1.70 - $1.85). When a stock is beaten down and management steps up to confirm the numbers, it usually means the capitulation selling is done. The bad news is fully priced in.
The Bottom Line: This is a classic "Smart Money" setup. The crowd is selling the fear, but the chart tells us we are at a generational support level. With an 8% yield and a 40-year technical floor, CAG is my top pick for a recovery trade heading into 2026.
Author

Gareth Soloway
Verified Investing
A renowned trader and financial expert specializing in chart analysis and market insights.