Tesla (TSLA) Stock Price and Forecast: Why is Tesla stock moving
- Tesla shares underperform the broad market on Wednesday.
- TSLA stock closes on Wednesday down just under 1%.
- S&P 500 and Nasdaq finish up on the day.

Tesla underperformed the broad market on Wednesday closing just under 1% lower at $655.29. Equity markets have been recovering from the hammering they took on Monday but Tesla did not get the memo and remained in a bearish mood. However, Tesla did skip the hammering on Monday when it outperformed the major equity indices by about 2%, Tesla stock closing in positive territory on Monday while most indices were down about 2%. Tuesday saw further consolidation but largely sideways range and Wednesday sees the stock slip slightly.
-637625450512150207.png)
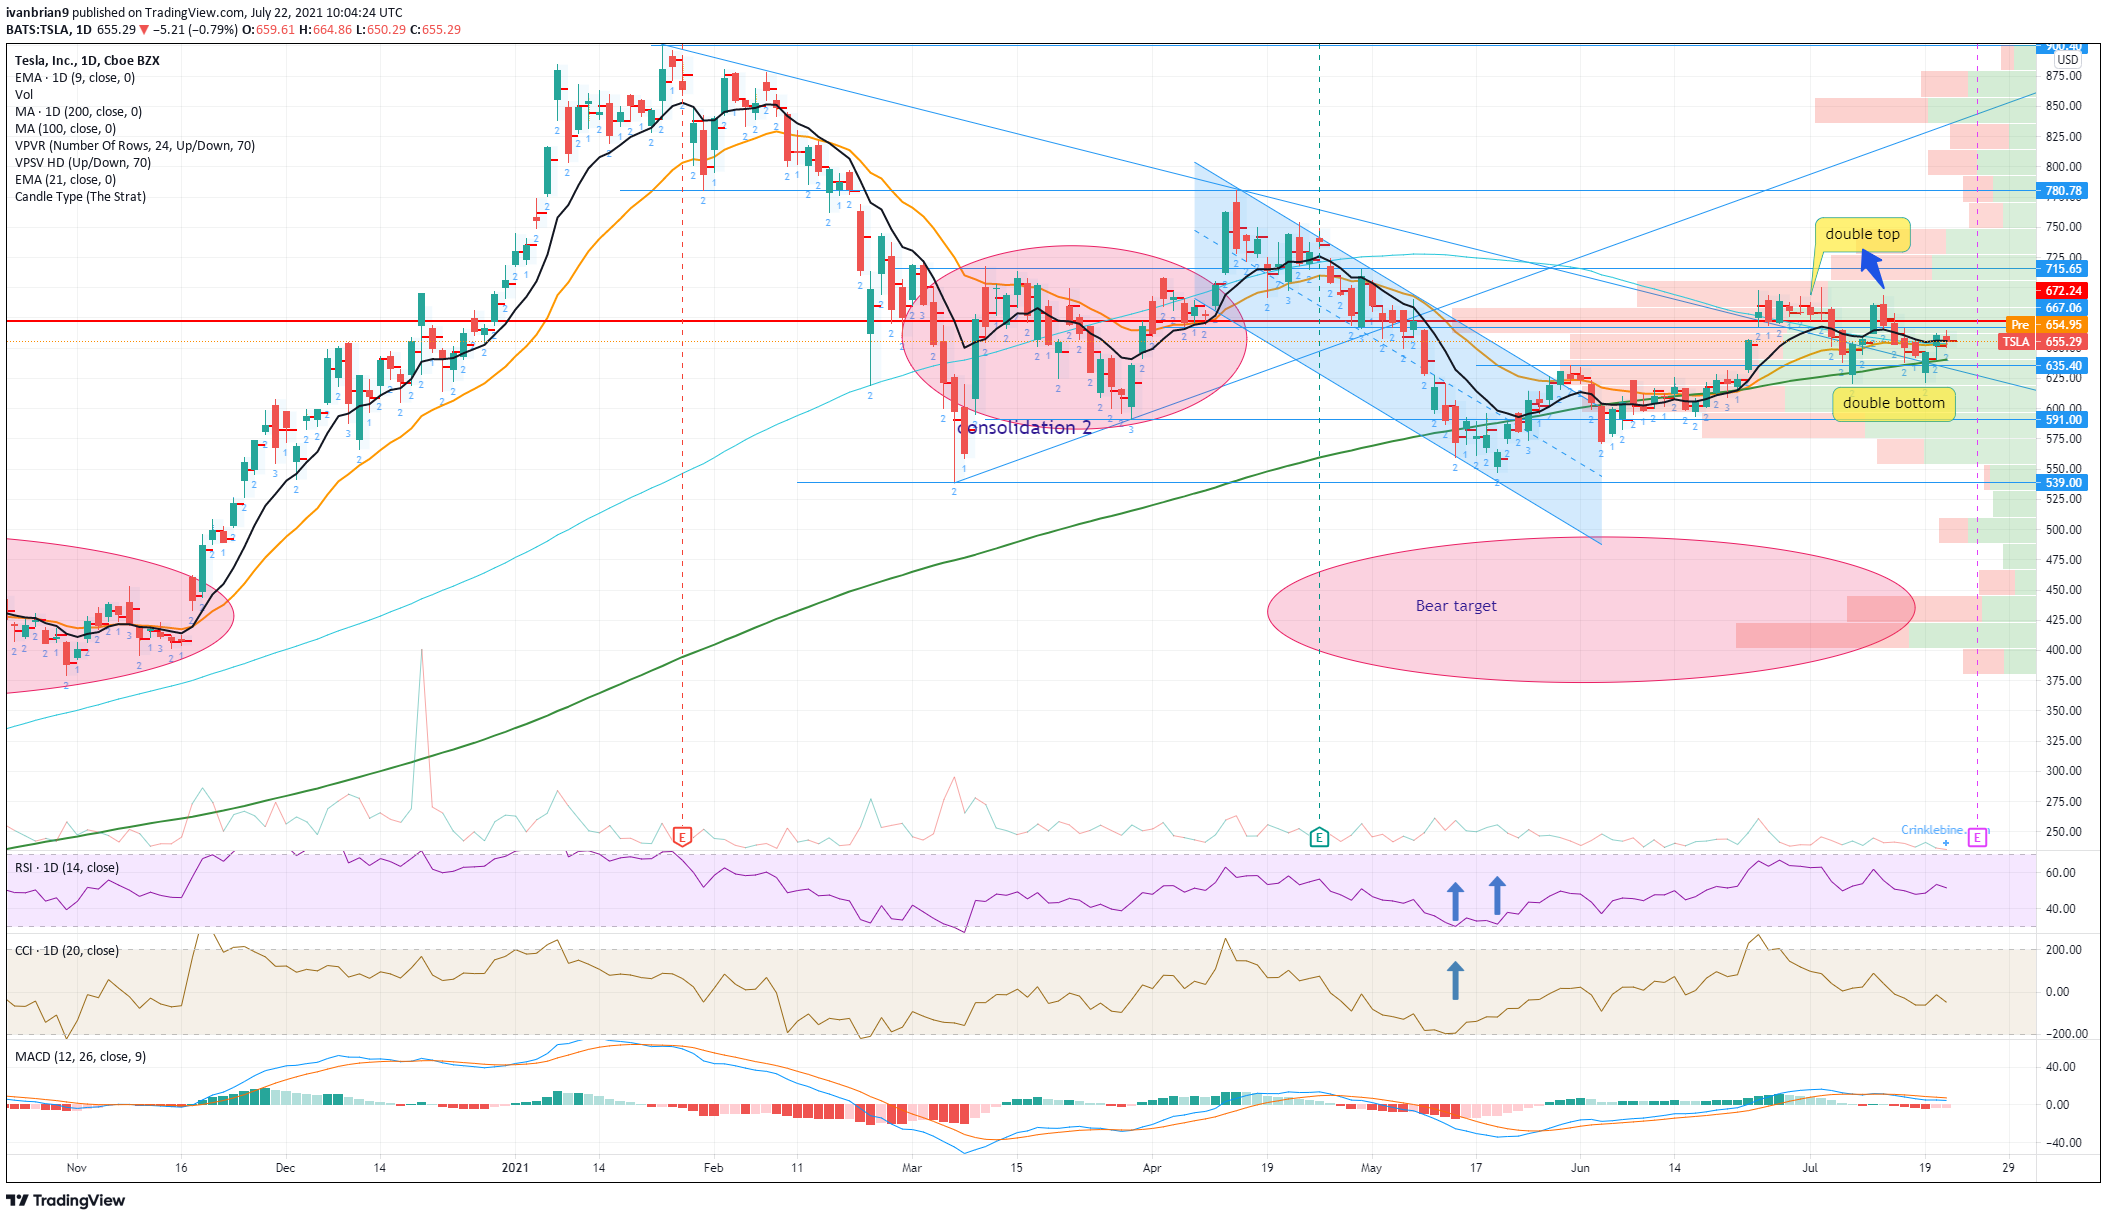
All this up and down and sideways moving without any strong trend in place is not too surprising given where we sit on the volume profile chart. The volume profile shows the volume at each price level. The higher the volume at a particular price then the more acceptance it has from traders, the more equilibrium so the slower any move through a price equilibrium zone. We can see clearly from the chart below the huge amount of volume at current levels. The point of control (the price with the highest volume) is currently at $682 while the area from $630 to $715 contains a large amount of volume. Also, the 200-day moving average sits at $641 further adding to the strong support zone.
When you add in the impending results' release next week it is not too surprising to see why Tesla is stuck rangebound as risk is reduced and traders are taking fewer positions before this release.
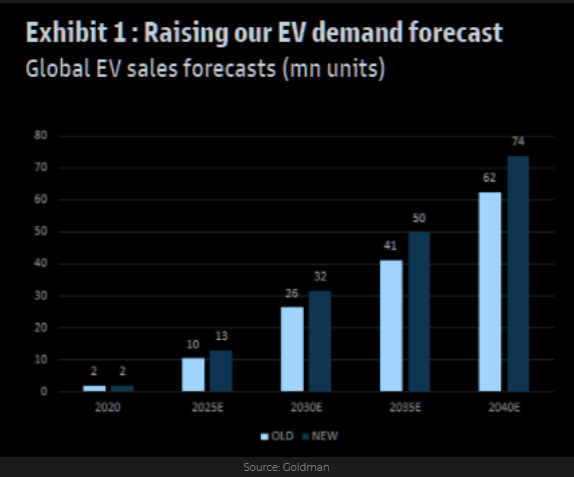
Some interesting sector news hit the tape yesterday which the market ear pointed out, Goldman Sachs giving the whole electric vehicle sector a boost as the investment bank increased its sales forecasts for electric vehicles. Goldman upped anticipated demand by up to 20%.
Tesla key statistics
| Market Cap | $630 billion |
| Price/Earnings | 651 |
| Price/Sales | 22 |
| Price/Book | 28 |
| Enterprise Value | $753 billion |
| Gross Margin | 23% |
| Net Margin |
3% |
| Average Wall Street Rating and Price Target | Hold, $671 |
Tesla stock forecast
Tesla has put in a not-so-nice double top formation and a more clean double-bottom formation but obviously both cancel each other out and hence the sideways rangebound trading TSLA is seeing. This is unlikely to be clarified until next week results are released and a bit more direction can hopefully be gleaned.
Our key levels remain unchanged $715 is the upside target where volume drops off meaning a break should see a price acceleration. The same goes for $591 below current levels.
Like this article? Help us with some feedback by answering this survey:
Premium
You have reached your limit of 3 free articles for this month.
Start your subscription and get access to all our original articles.
Author

Ivan Brian
FXStreet
Ivan Brian started his career with AIB Bank in corporate finance and then worked for seven years at Baxter. He started as a macro analyst before becoming Head of Research and then CFO.


