Tesla Stock Price and Forecast: Tesla stock drops on US autopilot probe
- Tesla collapses over 4% in the first thirty minutes of Monday.
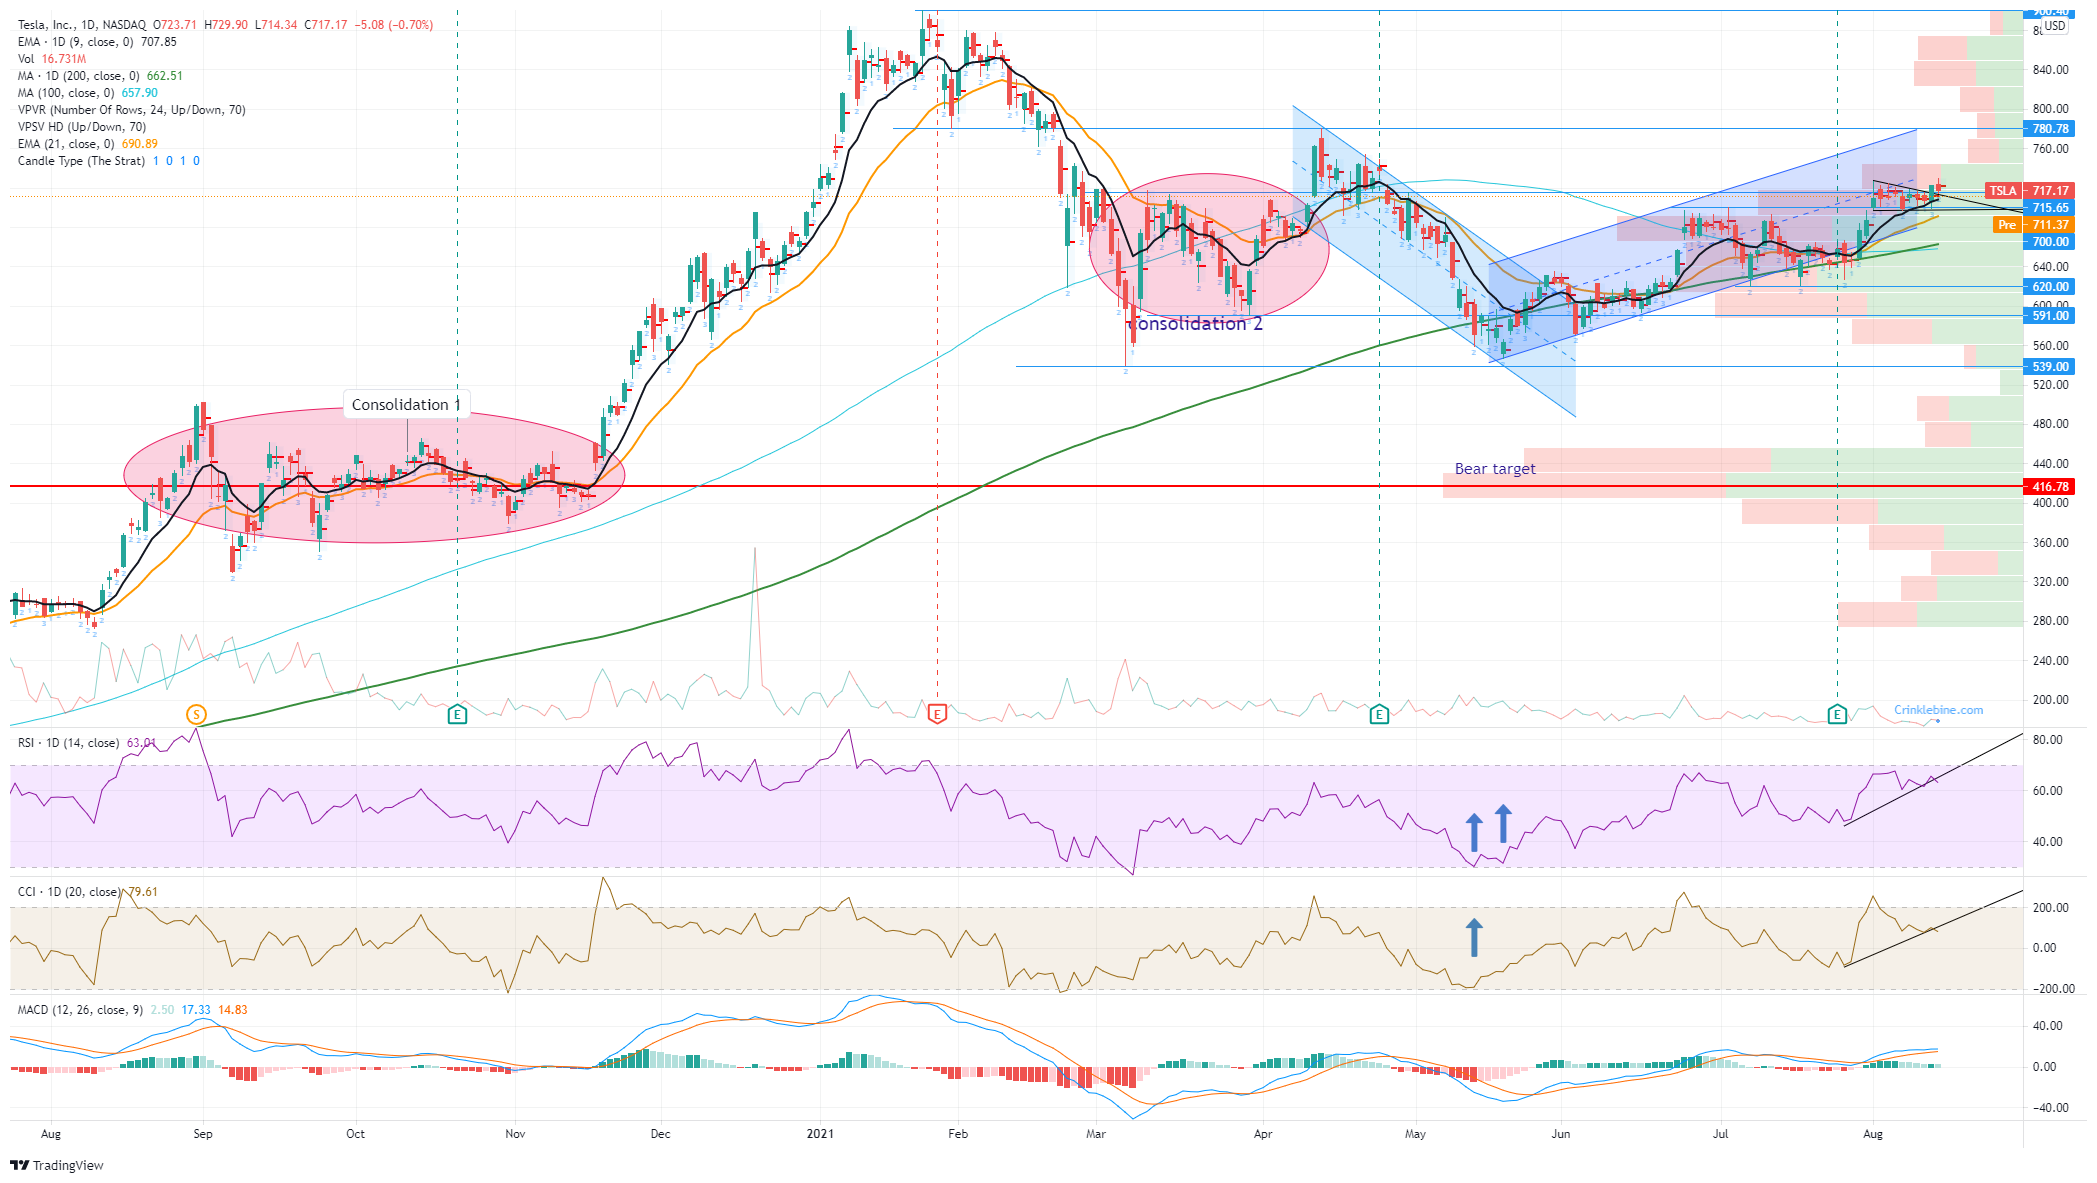
- TSLA had broken out higher from the wedge formation.
- Tesla dropping as US opens investigation into autopilot.

Update: Tesla stock collapsed over 4% in early trading on Monday as the stock crashed through the wedge formation it had promisingly broke up though last week. In the process Tesla has taken out its 9-day moving average and now looks bearish, having only looked set for further gains last week. The RSI and CCI have all broken lower adding to the bearishness. Reuters reports that "U.S. auto safety regulators said Monday they had opened a formal safety probe into Tesla Inc's (TSLA) driver assistance system Autopilot after a series of crashes involving emergency vehicles". "The National Highway Traffic Safety Administration (NHTSA) said that since January 2018, it had identified 11 crashes in which Tesla models "have encountered first responder scenes and subsequently struck one or more vehicles involved with those scenes.""
Tesla shares lost a bit of ground on Friday but nothing too drastic and still kept the recent bullish momentum in place. This trend has been brewing for some time with a triangle formation in place for most of August. Tesla stock has initially pushed through the psychological $700 level on the back of some strong earnings numbers and delivery data. The stock then stalled and consolidated above $700, readying itself for a push higher. Finally, last Thursday saw some action after days of pretty small activity in the stock. Tesla popped over 2% on Thursday, breaking out of the triangle formation, and Friday held onto the breakout despite losing 0.7% and closing at $717.17.
Tesla has produced pretty solid delivery numbers with steady growth showing in the recent earnings data. Margins also increased, which was reassuring as Tesla has reduced the price on some of its models in the face of increasing competition. Tesla did say in the earnings release that its average selling price had declined 2%, but its gross margins increased by over 3%. Analysts liked what they heard, with many upgrading their price targets post-earnings.
Tesla key statistics
| Market Cap | $702 billion |
| Price/Earnings | 358 |
| Price/Sales | 23 |
| Price/Book | 29 |
| Enterprise Value | $753 billion |
| Gross Margin | 22% |
| Net Margin |
6% |
| 52-week high | $900.40 |
| 52-week low | $273 |
| Average Wall Street Rating and Price Target | Hold, $711 |
Tesla stock forecast
Tesla has broken the triangle formation, a bullish move. The triangle was a continuation trend in line with the move higher after results. Breaking out of the triangle, therefore, is a bullish move that should see Tesla stock test the next big resistance at $780. This $780 level is the high from April. The volume begins to thin out in TSLA once the stock gets above $740, so the move should accelerate from there.
Bullish signs abound on this one with the momentum indicators pointing us higher in confirmation of the price trend. The Relative Strength Index (RSI), Commodity Channel Index (CCI) and Moving Average Convergence Divergence (MACD) are alll following the price higher. Tesla is also trading above the short-term moving averages – the 9 and 21-day. Holding the lower end of the triangle is key to keeping the bullish trend intact. This level is at $697. Below that the bullish trend is over and really a break of the 9-day at $707 will set alarm bells ringing for us. A general rule of thumb for breakouts is that it is alright for a retest of the breakout level, but the retracement does not want to go back into the consolidation zone or triangle in this case.
Like this article? Help us with some feedback by answering this survey:
Premium
You have reached your limit of 3 free articles for this month.
Start your subscription and get access to all our original articles.
Author

Ivan Brian
FXStreet
Ivan Brian started his career with AIB Bank in corporate finance and then worked for seven years at Baxter. He started as a macro analyst before becoming Head of Research and then CFO.