Tesla Stock Price and Forecast: With TSLA double top and double bottom, who wins? No one it seems
- Tesla is trading more or less flat in early dealing on Wednesday.
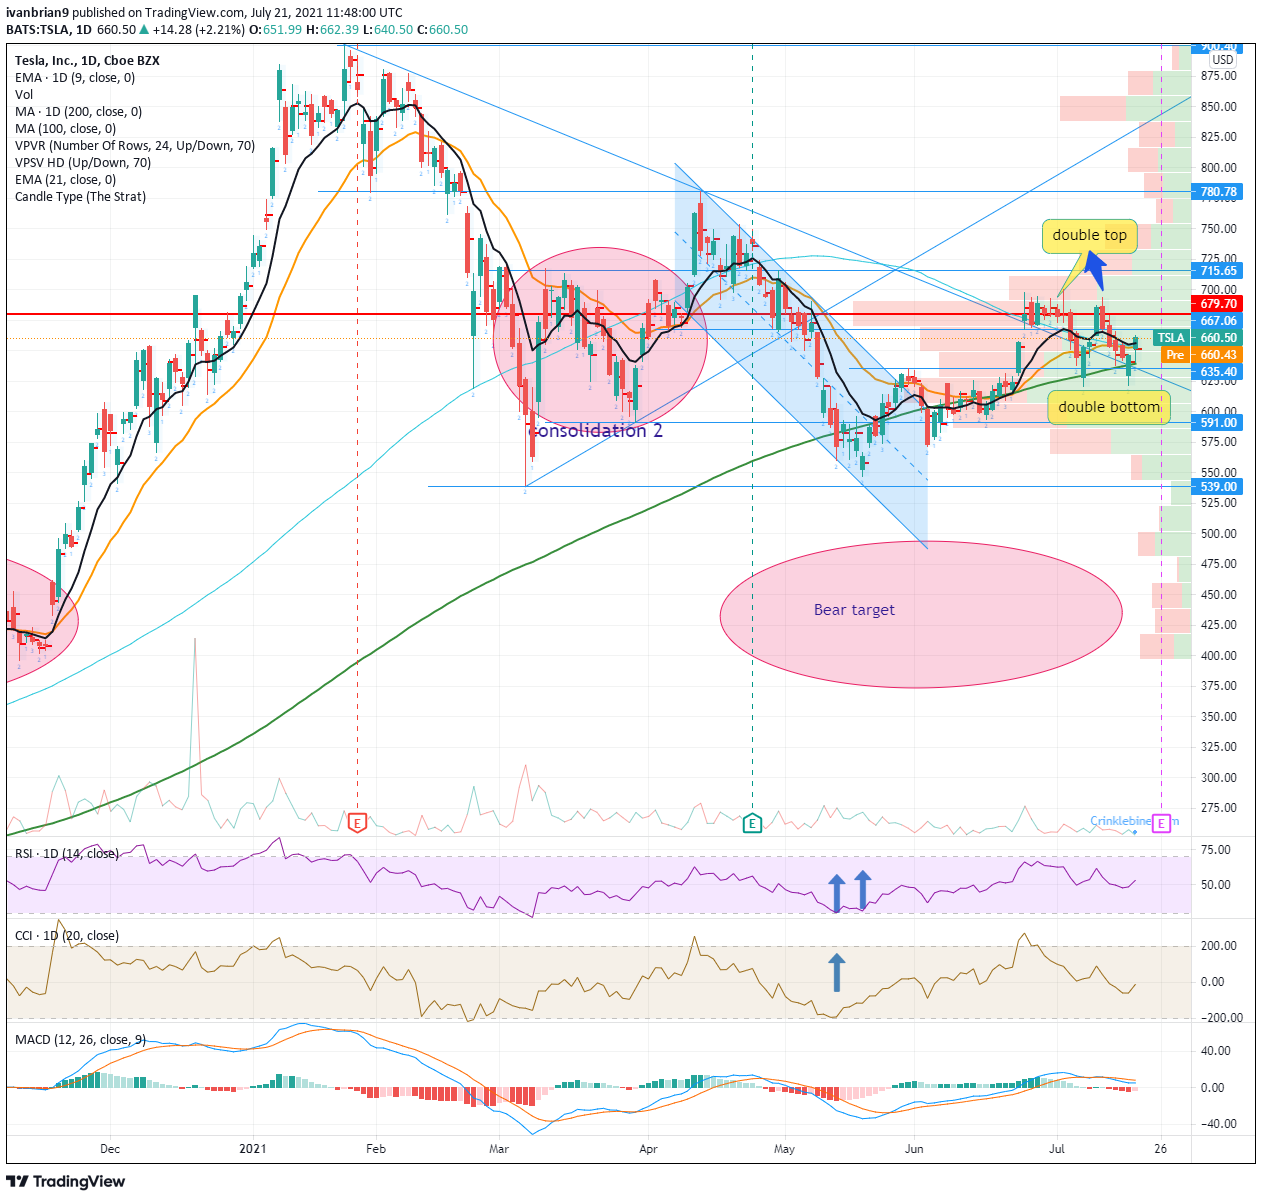
- Tesla puts in a small double bottom formation after a double top.
- TSLA is still in a choppy sideways range with results due next week.

Update: Early trading is pretty directionless for Tesla and with many stocks releasing results next week this is not too surprising. Big tech names kicked off yesterday with Netflix while Apple releases next week. Tesla is stuck in a high volume zone with a recent double top and then a double bottom, direction is tough to identify.
Tesla continued to recover ground on Tuesday as did most stocks in a rebound from the sharp losses on Monday. Tesla popped back to $660 and in the process has formed a small double bottom, which may be useful for some short-term trading possibilities. Overall though the stock remains relatively choppy, and the lack of a strong trend or indicator makes for some careful trading with stops and risk management taking on even more importance.
Monday had actually been a strong outperformance for the stock with general equity markets down about 2%. Tesla closed Monday in the green by just under half a percent – a relatively strong outperformance. The stock found support from the 200-day moving average and also the large amount of volume around that level added to the support.
Tesla key statistics
| Market Cap | $620 billion |
| Price/Earnings | 651 |
| Price/Sales | 22 |
| Price/Book | 28 |
| Enterprise Value | $753 billion |
| Gross Margin | 23% |
| Net Margin |
3% |
| Average Wall Street Rating and Price Target | Hold, $657 |
Tesla stock forecast
We can see the double bottom from the chart below and also clearly the 200-day moving average support and the large volume profile bars. This has all combined to give us some potential bullishness and skew the risk-reward toward taking long positions. Now steady there before you go charging into auto pilot for longs. We have results from Tesla next week, so that will cap any strong trend forming and likely lead to a continuation of the choppiness we have seen recently.
The 9-day moving average has now been taken, and the next confirmation we would like to see is the Moving Average Convergence Divergence (MACD) indicator cross back into bullish territory. This would give further momentum to the recovery. Taking out the double top highs around $695 should help spur the move further as volume begins to thin out above here.
Choppy trading is more likely as we can see Tesla sits in an area with a lot of volume. Breaking $715 or $591 brings us into zones of light volume, so a break will likely see a price acceleration.
Like this article? Help us with some feedback by answering this survey:
Premium
You have reached your limit of 3 free articles for this month.
Start your subscription and get access to all our original articles.
Author

Ivan Brian
FXStreet
Ivan Brian started his career with AIB Bank in corporate finance and then worked for seven years at Baxter. He started as a macro analyst before becoming Head of Research and then CFO.


