|

Tesla stock (TSLA) Elliott Wave forecasting the path

In this technical article we’re going to look at the Elliott Wave charts of  Tesla Stock ( TSLA ) published in members area of the website. As most traders probably know, the stock is in an overall bullish trend. However, in the short-term cycle from the 488.78 peak, the price has formed a lower lows structure.  In the following text, we will explain the Elliott Wave forecast in more detail.

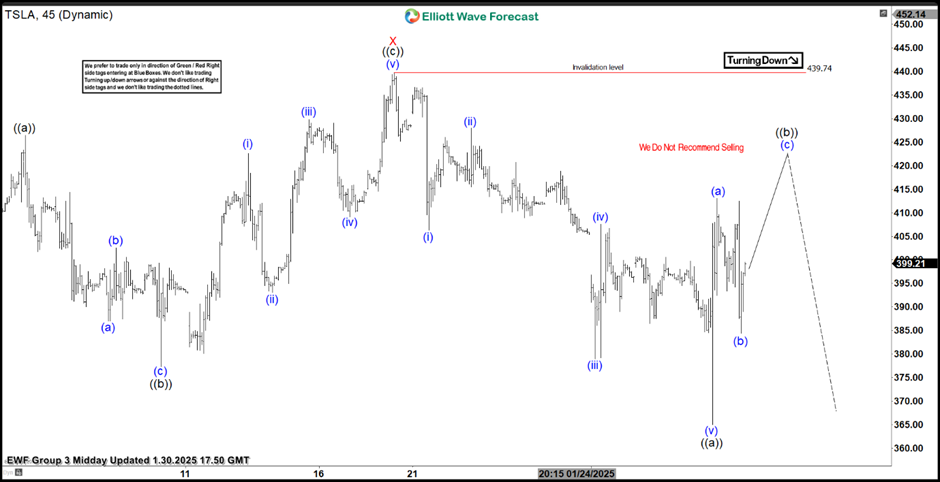
TSLA Elliott Wave one-hour chart 01.30.2025

Tesla stock is showing incomplete sequences in the cycle from the 488.78 peak. The break below the January 2nd low suggests that the cycle from the 488.78 peak is incomplete, indicating potential weakness in the near term. TSLA is targeting the 323.98 – 252.46 area, where we would like to be buyers again.

Let’s analyze the price structure further.

We can observe a clear 5-wave structure in the cycle from the 439.74 peak. A 3-wave bounce in the ((b)) recovery is expected. We anticipate another leg up in (c) before a decline takes place.

We do not recommend forcing trades at this stage. The strategy is to wait for the extreme zone to be reached before considering buying the stock again.

Chart

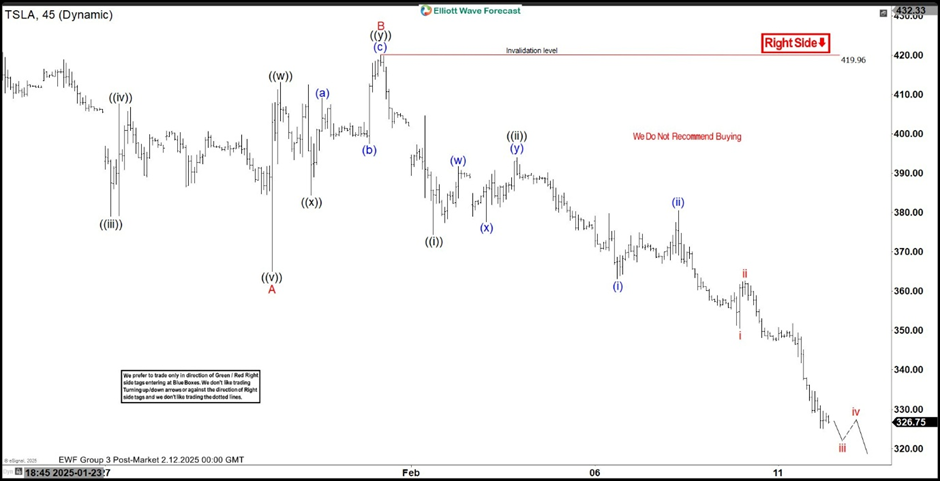
TSLA Elliott Wave one-hour chart 02.12.2025

Tesla stock made another leg up in the proposed recovery, completing it at the 419.96 high. After the correction ended, the price continued to decline, reaching new lows. It is now approaching our target area of 323.98–252.46. ( buyers zone).

Chart

Author

Elliott Wave Forecast Team

Elliott Wave Forecast Team

ElliottWave-Forecast.com

More from Elliott Wave Forecast Team
Share:

Markets move fast. We move first.

Orange Juice Newsletter brings you expert driven insights - not headlines. Every day on your inbox.

By subscribing you agree to our Terms and conditions.

Editor's Picks

EUR/USD holds above 1.1750 due to cautious trade before FOMC Minutes

EUR/USD holds ground after four days of little losses, trading around 1.1770 during the Asian hours on Tuesday. The pair remains steady as US Dollar moves little amid market caution ahead of the Federal Open Market Committee December Meeting Minutes due later in the day, which could offer insights into the Federal Reserve’s 2026 outlook.

GBP/USD finds key support near 1.35 despite year-end grind

GBP/USD remains bolstered on the high end as markets grind through the last trading week of the year. Cable caught a bullish tilt to keep price action on the high side of the 1.3500 handle, though year-end holiday volumes are unlikely to see significant progress in either direction as 2025 draws to a close.

Gold rises on Fed rate cut bets, safe-haven flows

Gold price edges higher above $4,350 during the early European trading hours on Tuesday. The precious metal recovers some lost ground after falling 4.5% in the previous session, which was gold's largest single-day loss since October.  Increased margin requirements on gold and silver futures by the Chicago Mercantile Exchange Group, one of the world’s largest trading floors for commodities, prompted widespread profit-taking and portfolio rebalancing.

Solana risks correction within descending wedge as bearish bets rise

Solana hovers above $120 at press time on Tuesday after a nearly 2% decline on Monday. The SOL-focused Exchange Traded Funds see renewed interest after recording their lowest weekly inflow last week.

Economic outlook 2026-2027 in advanced countries: Solidity test

After a year marked by global economic resilience and ending on a note of optimism, 2026 looks promising and could be a year of solid economic performance. In our baseline scenario, we expect most of the supportive factors at work in 2025 to continue to play a role in 2026.

Crypto market outlook for 2026

Year 2025 was volatile, as crypto often is.  Among positive catalysts were favourable regulatory changes in the U.S., rise of Digital Asset Treasuries (DAT), adoption of AI and tokenization of Real-World-Assets (RWA).