Tesla Stock News and Forecast: TSLA loses more ground as Elon Musk sells $3.6 billion worth
- Tesla CEO Elon Musk has reportedly sold $3.6 billion worth of TSLA stock.
- Elon Musk's selling caused Tesla stock to decline in price this week in contrast to the NASDAQ.
- TSLA shares have fallen 11% in the past five sessions against the NASDAQ's 2% gain.
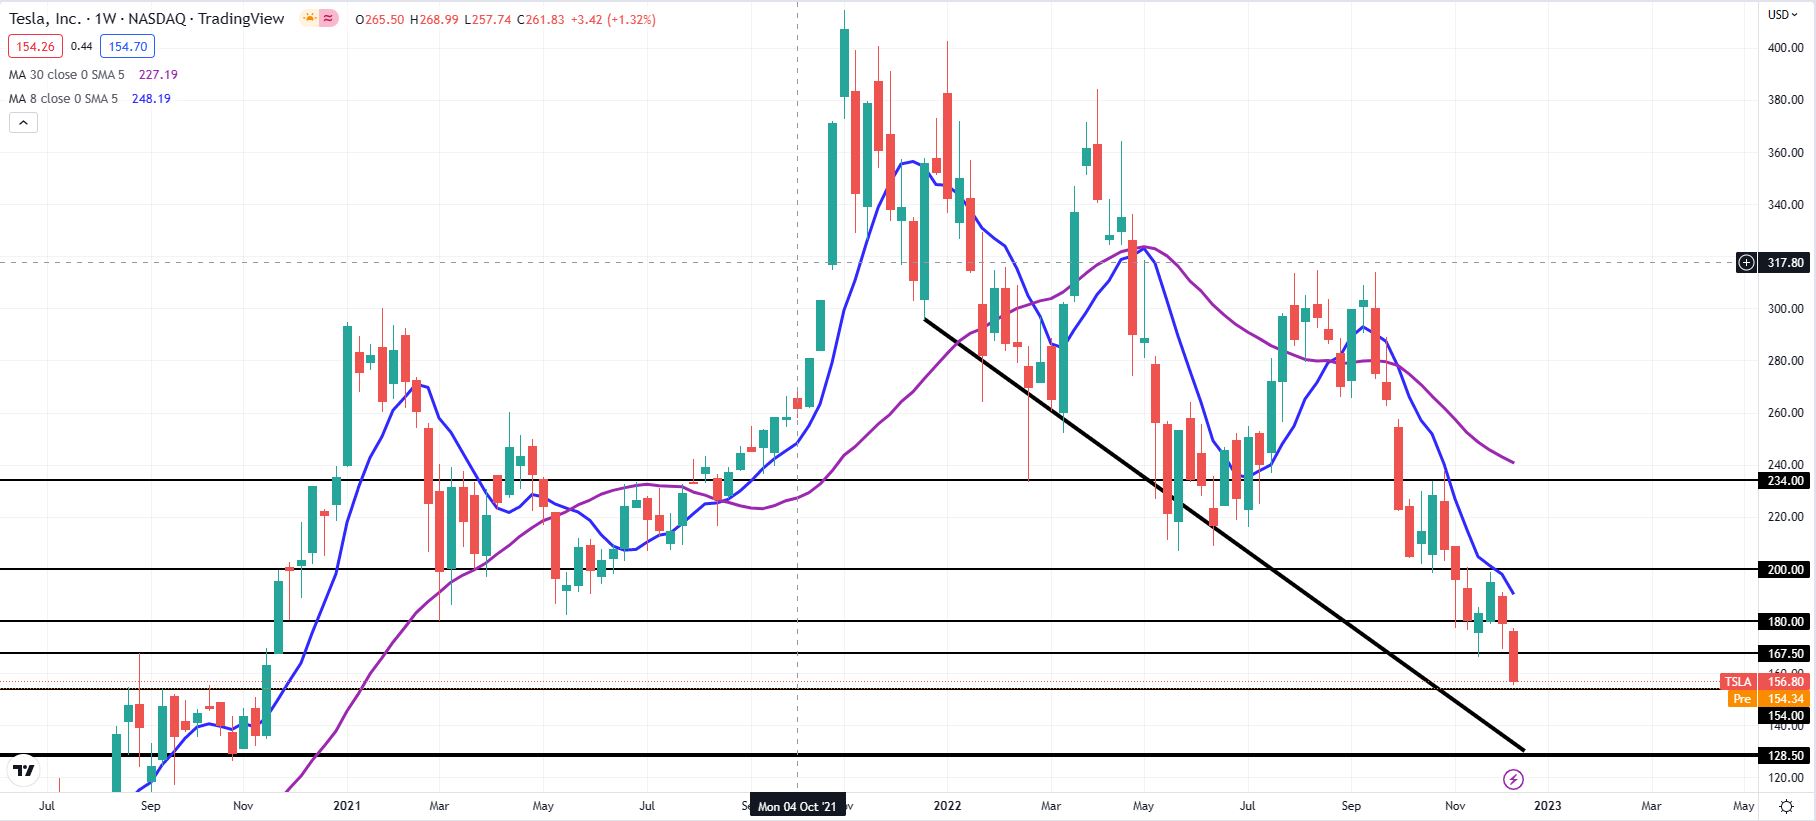
- Tesla stock is near support at $154 but could drop to $128.50.
Tesla (TSLA) continues its December slide on Thursday a day after it was revealed that CEO Elon Musk has sold out $3.6 billion worth of shares. The news makes the past week's TSLA price action more sensible as observant traders wondered aloud why Tesla kept selling off despite the NASDAQ climbing higher. Tesla stock is down around 2% in Thursday's premarket, even reaching below long-term support at $154.
Tesla stock news: Elon Musk sells 20 million shares
In the three sessions between Monday, December 12, and Wednesday, December 14, Elon Musk sold about 20.2 million shares of Tesla stock. These sales ranged from a high of $176.70 to a low of $156.14. Musk began the week with 443.8 million shares of TSLA and ended Wednesday with 423.6 million shares. Altogether these sales brought in about $3.58 billion in cash. Elon Musk has sold a total of about $40 billion worth of Tesla stock in the last year, most of which went to fund his takeover of Twitter.
This selling has resulted in TSLA stock losing 11% over the past five sessions compared with a 2% gain for the NASDAQ. Tesla has lost 17% over the past month and now 61% for the full year.
"It doesn't put a lot of confidence in the business, or speak volumes for where his attention is at," wrote Tony Sycamore, an analyst at IG Markets.
This stock performance is beginning to leave bulls with anxiety. Tesla stock has been suffering from Musk's focus on Twitter for months now. Since fully taking over the social media platform six weeks ago, Musk's constant flurry of shockingly partisan political tweets have made some analysts lose faith in his leadership abilities. Recently, he tweeted: "My pronouns are prosecuted/Fauci", in reference to the main covid advisor during the Trump and Biden administrations.
Noted long-time Tesla bull Dan Ives of Wedbush Securities was quite blunt on the matter of Musk's activity: "The Twitter nightmare continues as Musk uses Tesla as his own ATM machine to keep funding the red ink at Twitter[,] which gets worse by the day as more advertisers flee the platform with controversy increasing driven by Musk."
RBC Capital Markets cut its price target early Thursday from $325 to $225, saying that the market was slowly getting its head around the reduction in gross profit margins.
Morgan Stanely is also rather melancholy about the electric vehicle industry of late. The storied investment bank cut its global EV share estimate to 11.8% for 2023 compared to 10.1% in 2022. Its estimates going out to 2050 were trimmed as well. The bank noted that Lucid Group (LCID) has been receiving lower reservations and cancellations and that Rivian Automotive (RIVN) has halted reporting reservations entirely.
"We are preparing for a challenging FY23 outlook for auto earnings on demand decline (higher rates), deflation (lower price/mix) and unfavorable changes in the supply/demand balance for EVs," wrote Morgan Stanely analyst Adam Jonas in a note to clients earlier this week.
Tesla stock forecast: If $154 cannot hold, then $128.50 is next
Tesla stock fell below the $154 support level in Thursday's premarket, which is probably a bad omen for bulls. The $154 level served as resistance back during August and October 2020, and the hope was that it would reemerge as support. The next available historical support price available to cushion a further fall is all the way down at $128.50. This one comes from the level that saw support during that same period in the second half of 2020. Additionally, a year-old descending trendline that goes back to December 2021 leads the TSLA share price toward this $128.50 level.
Author

Clay Webster
FXStreet
Clay Webster grew up in the US outside Buffalo, New York and Lancaster, Pennsylvania. He began investing after college following the 2008 financial crisis.


