|

Tesla Inc. ($TSLA) reacting higher from another extreme area

Hello everyone. In today’s article, we will look at the past performance of the 1H Hour Elliott Wave chart of Tesla Inc. ($TSLA). The rally from 10.31.2023 low unfolded as a 5 wave impulse. So, we expected the pullback to unfold in 3 swings (ABC) and find buyers again. We will explain the structure & forecast below:

$TSLA 1H Elliott Wave chart 11.10.2023

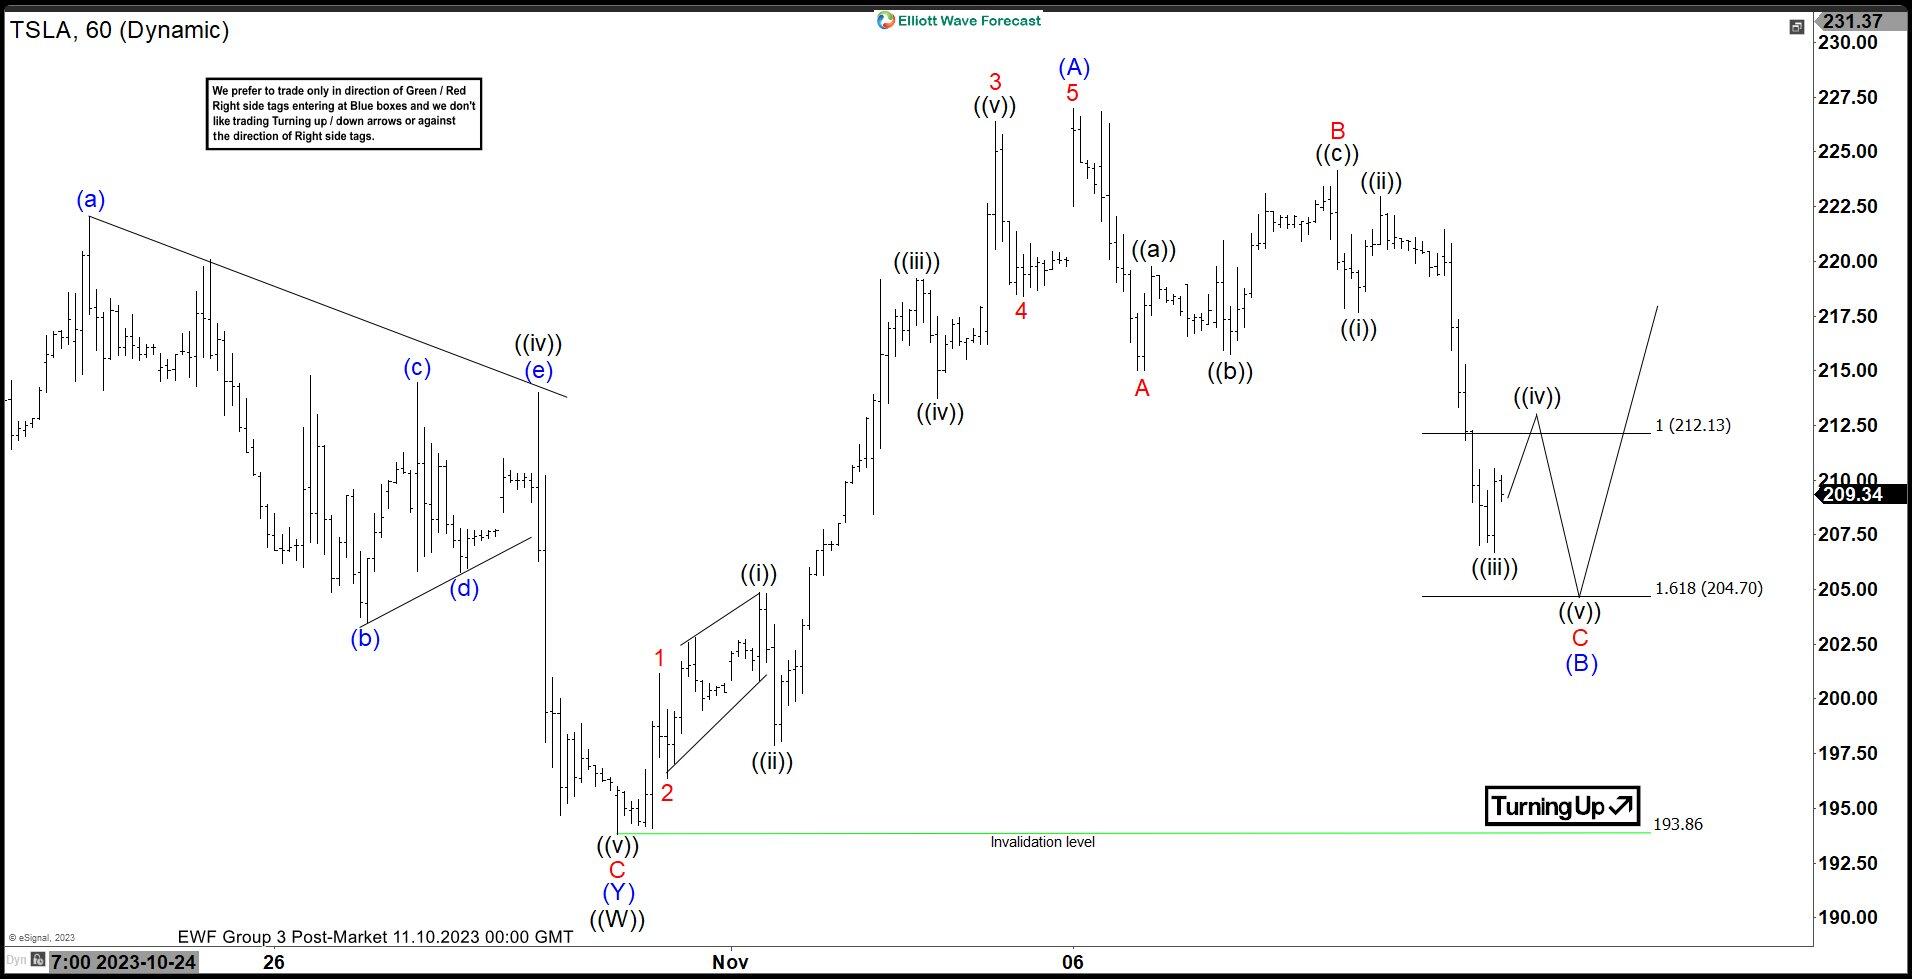
Here is the 1H Elliott Wave count from 11.10.2023. The 5 waves rally from $193.86 peaked at blue (A) and started a pullback to correct it. We expected the pullback to find buyers at (B) in 3 swings at $212.13 – 204.70.

$TSLA 1H Elliott Wave chart 11.12.2023

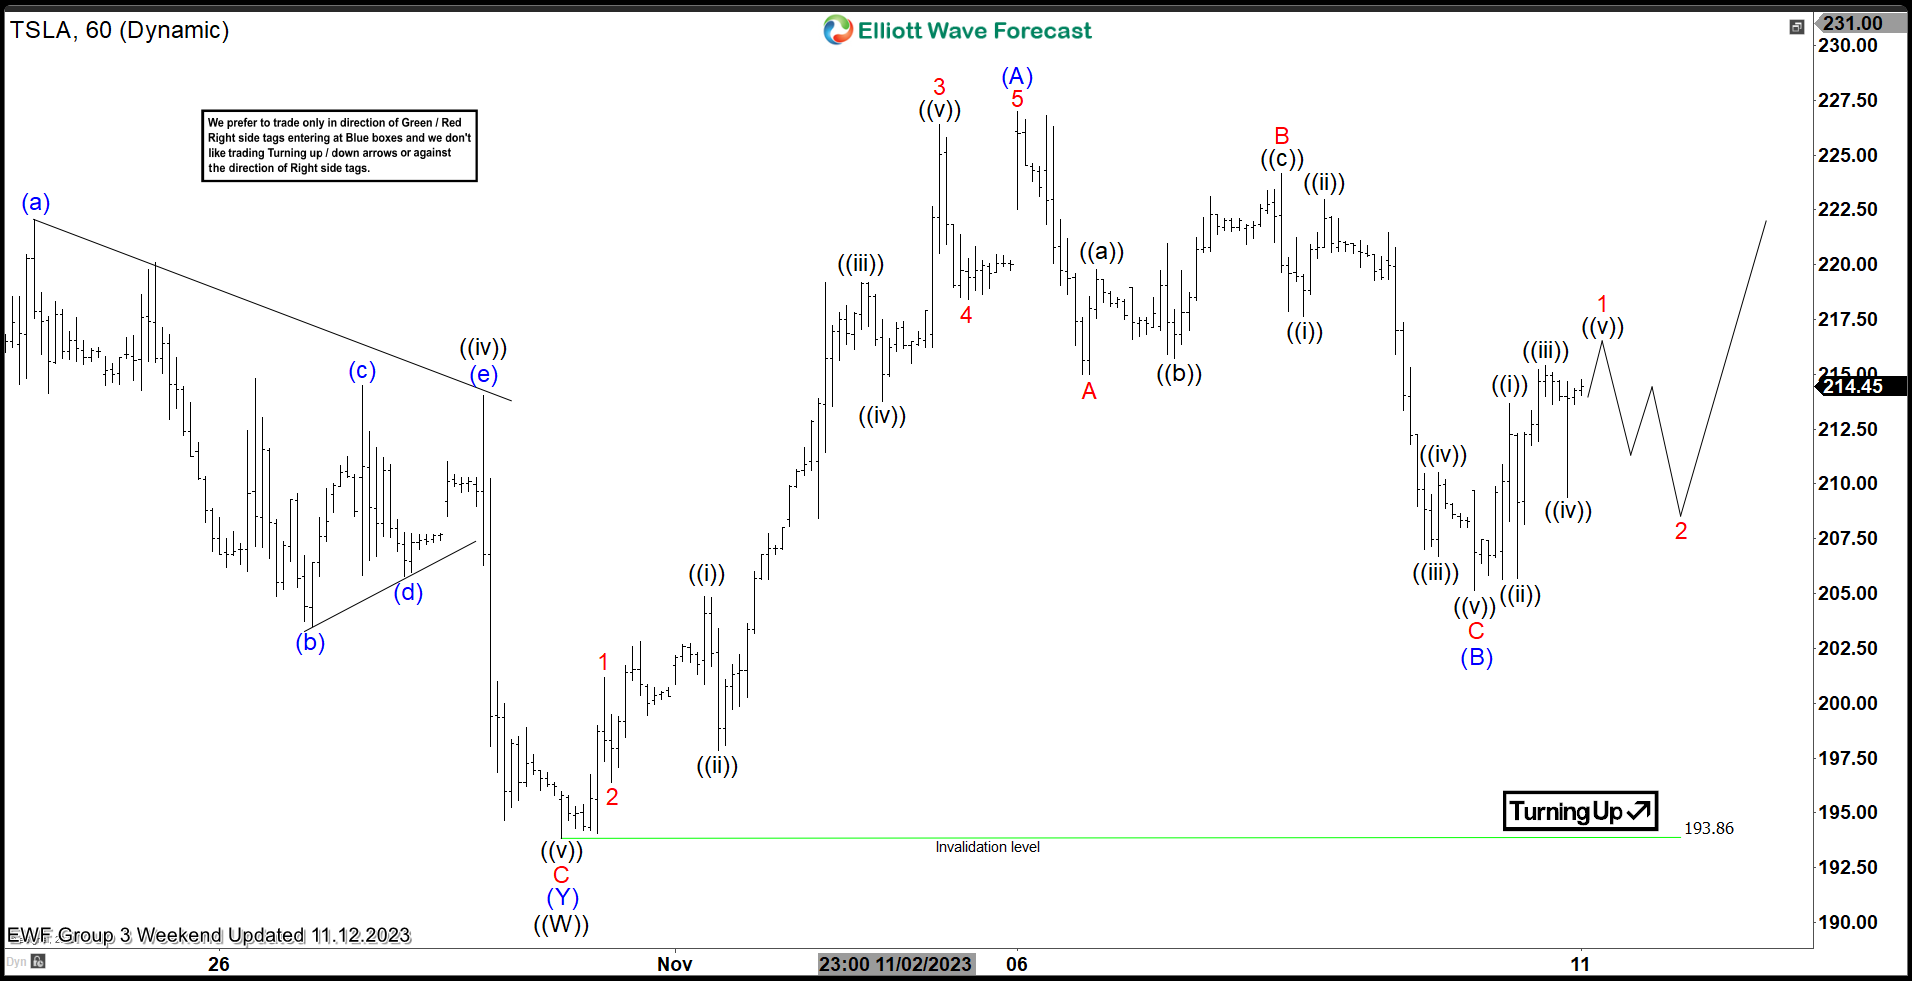
Here is the 1H update from 11.12.2023 showing the bounce taking place as expected. The stock reacted higher after reaching the equal legs area allowing longs to get a risk free position. We expect the stock to continue higher towards 238 – 258 before a pullback can happen. Alternatively, if the stock is unable to break above $227 at blue (A) then a double correction lower can happen (WXY) before higher.

Author

Elliott Wave Forecast Team

Elliott Wave Forecast Team

ElliottWave-Forecast.com

More from Elliott Wave Forecast Team
Share:

Markets move fast. We move first.

Orange Juice Newsletter brings you expert driven insights - not headlines. Every day on your inbox.

By subscribing you agree to our Terms and conditions.

Editor's Picks

EUR/USD bounces toward 1.1750 as US Dollar loses strength

EUR/USD returned to the 1.1750 price zone in the American session on Friday, despite falling Wall Street, which indicates risk aversion. Trading conditions remain thin following the New Year holiday and ahead of the weekend, with the focus shifting to US employment and European data scheduled for next week.

GBP/USD nears 1.3500, holds within familiar levels

After testing 1.3400 on the last day of 2025, GBP/USD managed to stage a rebound. Nevertheless, the pair finds it difficult to gather momentum and trades with modest intraday gains at around 1.3490 as market participants remain in holiday mood.

Gold trims intraday gains, approaches $4,300

Gold retreated sharply from the $4,400  area and trades flat for the day in the $4,320 price zone. Choppy trading conditions exacerbated the intraday decline, although XAU/USD bearish case is out of the picture, considering growing expectations for a dovish Fed and persistent geopolitical tensions.

Cardano gains early New Year momentum, bulls target falling wedge breakout

Cardano kicks off the New Year on a positive note and is extending gains, trading above $0.36 at the time of writing on Friday. Improving on-chain and derivatives data point to growing bullish interest, while the technical outlook keeps an upside breakout in focus.

Economic outlook 2026-2027 in advanced countries: Solidity test

After a year marked by global economic resilience and ending on a note of optimism, 2026 looks promising and could be a year of solid economic performance. In our baseline scenario, we expect most of the supportive factors at work in 2025 to continue to play a role in 2026.

Crypto market outlook for 2026

Year 2025 was volatile, as crypto often is.  Among positive catalysts were favourable regulatory changes in the U.S., rise of Digital Asset Treasuries (DAT), adoption of AI and tokenization of Real-World-Assets (RWA).