|

Tesla Inc ($TSLA) blue box area wins again – What’s next?

In today’s article, we will look at the past performance of the 1 Hour Elliott Wave chart of Tesla Inc. ($TSLA) The rally from 4.27.2023 low unfolded as a 5 wave impulse with an incomplete bullish sequence from 6.26.2023 low. So, we advised members to buy the pullback in 7 swings (WXY) at the blue box area ($269.45 – 262.39). We will explain the structure & forecast below:

$TSLA 1H Elliott Wave chart 7.10.2023

Chart

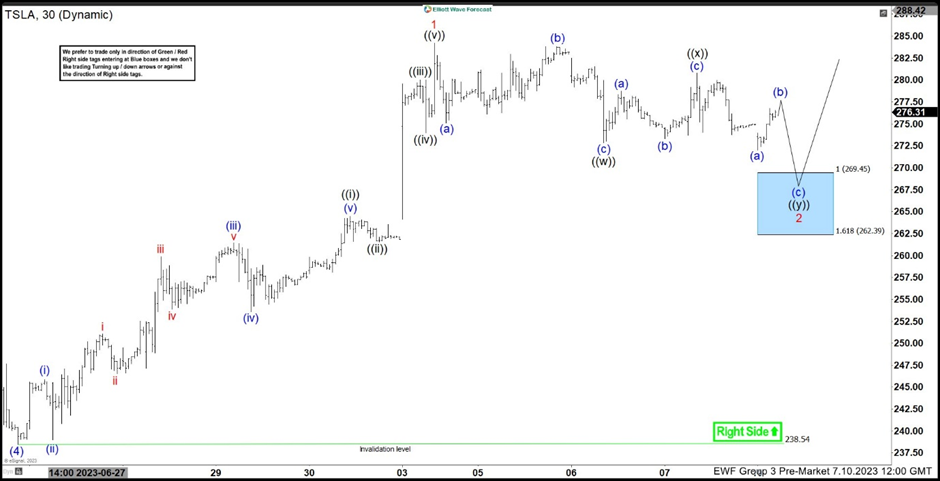
Here is the 1H Elliott Wave count from 7.10.2023. The rally from 6.26.2023 low at blue (4) unfolded in a 5 wave impulse which signaled a bullish trend. We expected the pullback to find buyers in 7 swings at $269.45 – 262.39 where we entered as buyers.

$TSLA 1H Elliott Wave chart 7.16.2023

Chart

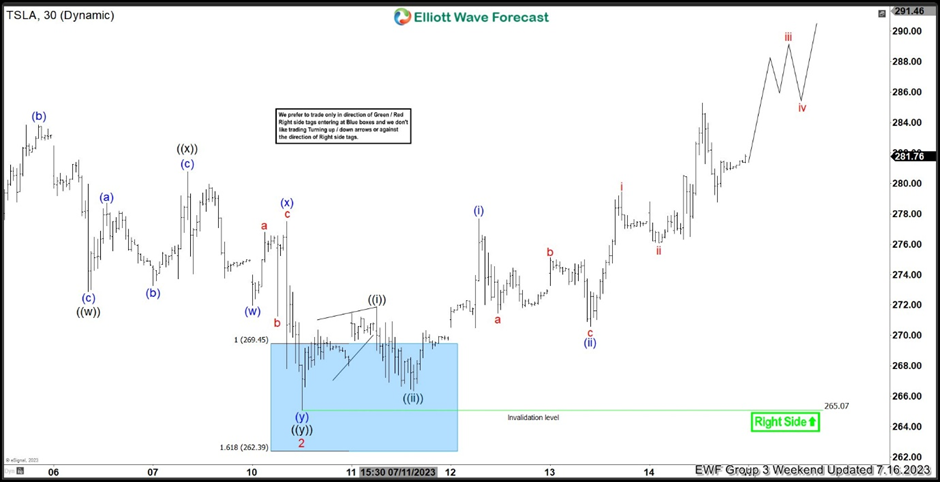
Here is the latest 1H weekend update showing the move taking place as expected. The stock has reacted higher from the blue box area allowing longs to get a risk free position and breaking above 7.03.2023 peak creating another bullish sequence. From here, we expect more upside towards $311 – 340 area in the near term and eventually a new all time high.

Author

Elliott Wave Forecast Team

Elliott Wave Forecast Team

ElliottWave-Forecast.com

More from Elliott Wave Forecast Team
Share:

Markets move fast. We move first.

Orange Juice Newsletter brings you expert driven insights - not headlines. Every day on your inbox.

By subscribing you agree to our Terms and conditions.

Editor's Picks

EUR/USD declines toward 1.1700 on solid USD recovery

EUR/USD turns south and declines toward 1.1700 on Wednesday. A solid comeback staged by the US Dollar weighs heavily on the pair, as traders look to USD short covering ahead of US CPI on Thursday. However, the downside could be capped by hawkish ECB expectations. 

GBP/USD slides toward 1.3300 after softer-than-expected UK inflation data

GBP/USD has come under intense selling pressure, eyeing 1.3300 in the European session on Wednesday. The UK annual headline and core CPI rose by 3.2% each, missing estimates of 3.5% and 3.4%, respectively, reaffirming dovish BoE expectations and smashing the Pound Sterling across the board. 

Gold clings to modest gains above $4,300

Following Tuesday's volatile action, Gold regains its traction on Wednesday and trades in positive territory above $4,300. While the buildup in the USD recovery momentum caps XAU/USD's upside, the cautious market stance helps ithe pair hold its ground.

Bitcoin, Ethereum and Ripple extend correction as bearish momentum builds

Bitcoin, Ethereum, and Ripple remain under pressure as the broader market continues its corrective phase into midweek. The weak price action of these top three cryptocurrencies by market capitalization suggests a deeper correction, as momentum indicators are beginning to tilt bearish.

Ukraine-Russia in the spotlight once again

Since the start of the week, gold’s price has moved lower, but has yet to erase the gains made last week. In today’s report we intend to focus on the newest round of peace talks between Russia and Ukraine, whilst noting the release of the US Employment data later on day and end our report with an update in regards to the tensions brewing in Venezuela.

AAVE slips below $186 as bearish signals outweigh the SEC investigation closure

Aave (AAVE) price continues its decline, trading below $186 at the time of writing on Wednesday after a rejection at the key resistance zone. Derivatives positioning and momentum indicators suggest that bearish forces still dominate in the near term.