Technical analysis: Will the Thyssenkrupp stock price continue advancing?

ThyssenKrupp technical analysis summary
Buy Stop: Above 9.46.
Stop Loss: Below 8.73.
| Indicator | Signal |
| RSI | Neutral |
| MACD | Buy |
| Donchian Channel | Buy |
| MA(200) | Sell |
| Fractals | Neutral |
| Parabolic SAR | Buy |
ThyssenKrupp chart analysis
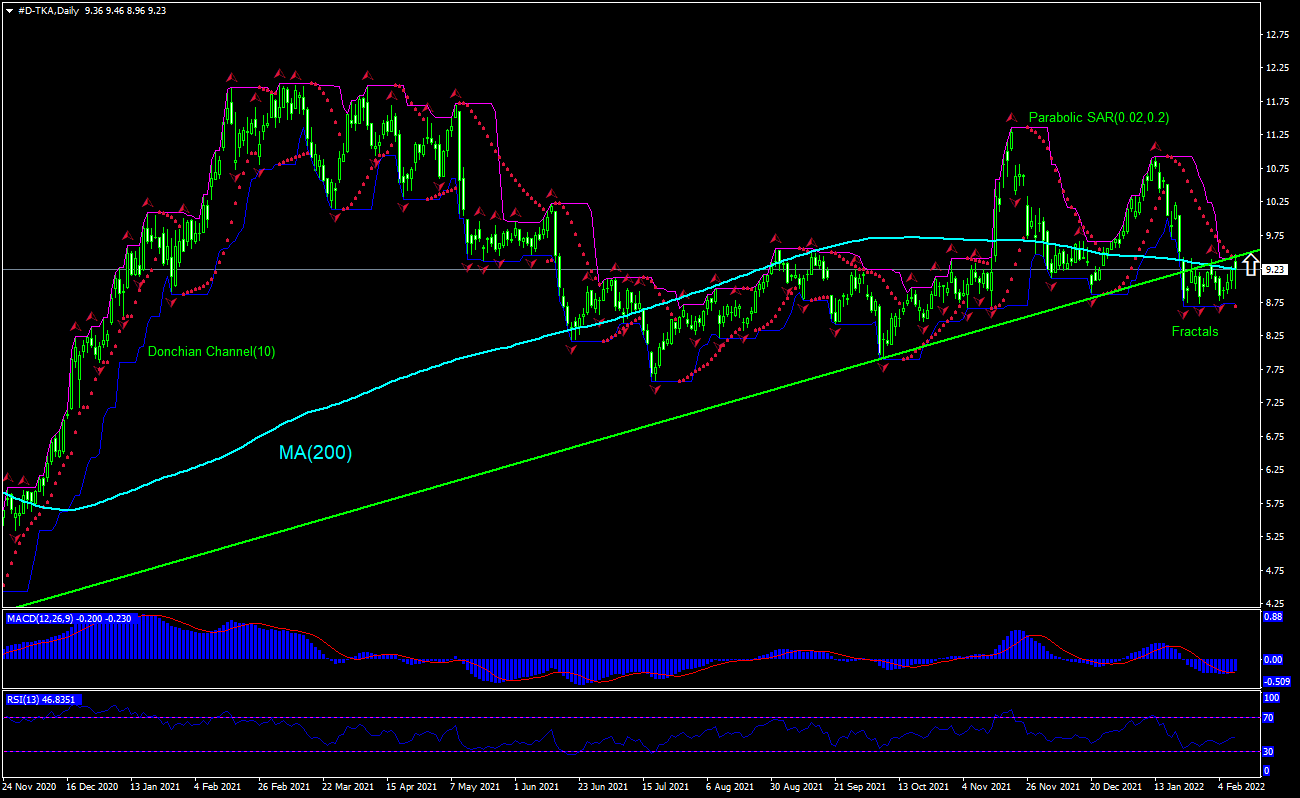
The technical analysis of the Thyssenkrupp stock price chart on daily timeframe shows #D-TKA, Daily is testing the 200-day moving average MA(200) and the support line. We believe the bullish momentum will continue after the price breaches above the upper boundary of Donchian channel at 9.46. This level can be used as an entry point for placing a pending order to buy. The stop loss can be placed below 8.73. After placing the order, the stop loss is to be moved every day to the next fractal low, following Parabolic indicator signals. Thus, we are changing the expected profit/loss ratio to the breakeven point. If the price meets the stop loss level (8.73) without reaching the order (9.46), we recommend cancelling the order: the market has undergone internal changes which were not taken into account.
Fundamental Analysis of Stocks - ThyssenKrupp
Thyssenkrupp stock price closed virtually flat after positive quarterly report. Will the Thyssenkrupp stock price continue advancing?
Thyssenkrupp AG is a German industrial conglomerate which builds automotive equipment and marine systems, manufactures industrial components and systems. Its market capitalization is €5.3 billion. The stock is trading at forward P/E ratio of 8.9 currently and the revenue for the trailing twelve months was €34.0 billion, while the Return on Equity (ttm) was -0.18%. Thyssenkrupp reported yesterday that operating profit rose nearly fivefold in the October-December period, its first quarter, with earnings of its two biggest divisions - steel and materials trading - buoyed by significantly higher steel prices. Higher profits are bullish for stock price. At the same time Thyssenkrupp's automotive technology unit suffers from ongoing shortage of semiconductors, causing operating profit to fall by two thirds in the period. Stock price closed down on the day. Ongoing bottlenecks in the supply chain are a downside risk for the Thyssenkrupp stock price.
Want to get more free analytics? Open Demo Account now to get daily news and analytical materials.
Want to get more free analytics? Open Demo Account now to get daily news and analytical materials.
Premium
You have reached your limit of 3 free articles for this month.
Start your subscription and get access to all our original articles.
Author

Dmitry Lukashov
IFC Markets
Dimtry Lukashov is the senior analyst of IFC Markets. He started his professional career in the financial market as a trader interested in stocks and obligations.


