Technical analysis: Will the Johnson and Johnson stock price continue retreating?

Johnson & Johnson technical analysis summary
Sell Stop։ Below 166.95.
Stop Loss: Above 171.82.
| Indicator | Signal |
| RSI | Buy |
| MACD | Sell |
| Donchian Channel | Sell |
| MA(200) Buy Fractals | Sell |
| Parabolic SAR | Sell |
| Fibonacci | Sell |
Johnson & Johnson chart analysis
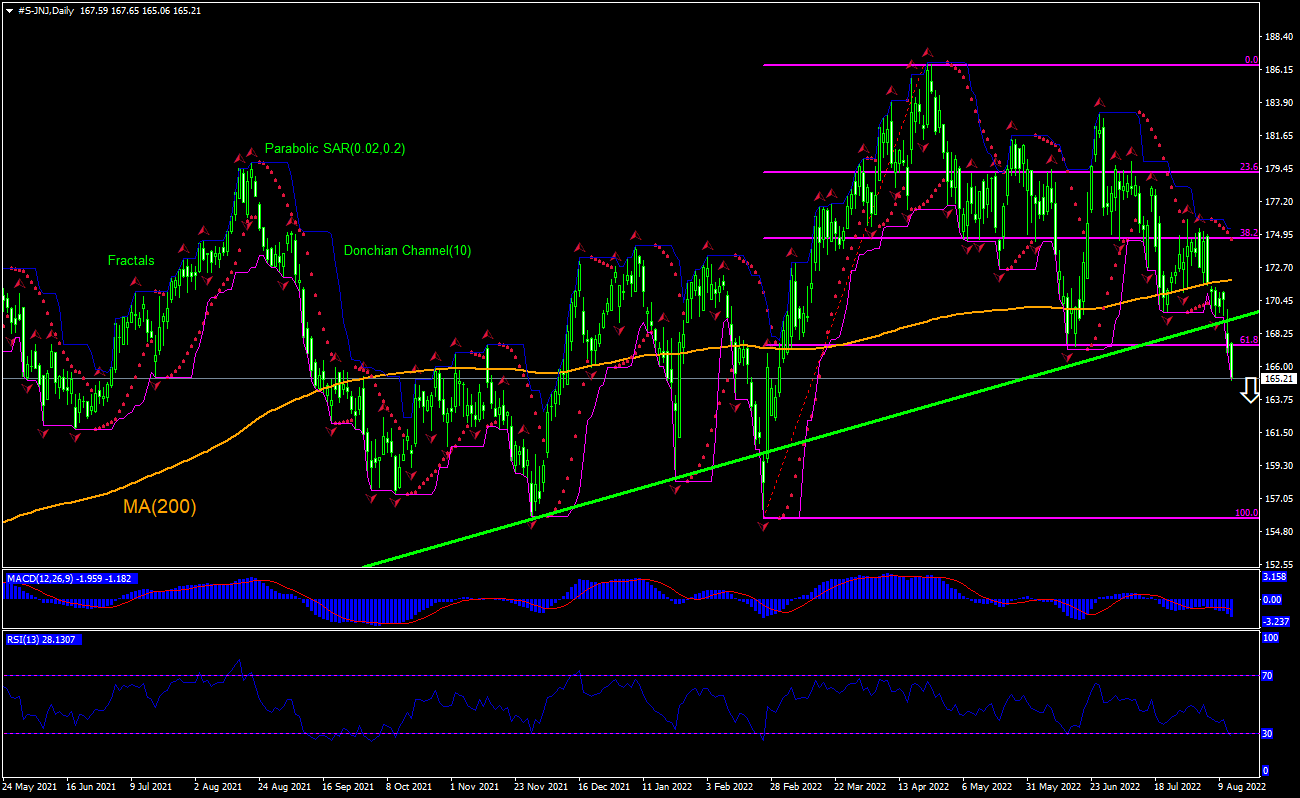
The technical analysis of the Johnson & Johnson stock price chart on daily timeframe shows #S-JNJ,Daily is falling after breaching below the 200-day moving average MA(200) and has fallen below a support. The RSI however is in the oversold zones. We believe the bearish momentum will resume after the price breaches below the lower Donchian bound at 166.95. This level can be used as an entry point for placing a pending order to sell. The stop loss can be placed above 171.82. After placing the order, the stop loss is to be moved every day to the next fractal high, following Parabolic indicator signals. Thus, we are changing the expected profit/loss ratio to the breakeven point. If the price meets the stop loss level (171.82) without reaching the order (166.95), we recommend cancelling the order: the market has undergone internal changes which were not taken into account.
Fundamental analysis of stocks – Johnson & Johnson
Johnson & Johnson announced it will discontinue talc-based baby powder in 2023. Will the Johnson & Johnson stock price continue retreating?
Johnson & Johnson is a United States corporation that develops, manufactures and sells various products in the healthcare field worldwide. Its market capitalization is $434.4 billion. The stock is trading at P/E ratio (Trailing Twelve Months) of 24.33 currently, company’s revenue (ttm) was $95.6 billion, while the Return on Equity (ttm) was 25.17% and the Return on Assets (ttm) at 8.9%. Johnson & Johnson has announced it will stop selling talc-based baby powder globally in 2023. J&J faces more than 40,000 lawsuits for its talc-based products, which allege that its talc products contain asbestos that causes cancer. J&J has established a $2 billion trust to resolve this claims, as well as allocated a royalty revenue stream with a present value of over $350 million to supplement the fund. The stock price closed down 1.1% over day after announcement.
Want to get more free analytics? Open Demo Account now to get daily news and analytical materials.
Want to get more free analytics? Open Demo Account now to get daily news and analytical materials.
Author

Dmitry Lukashov
IFC Markets
Dimtry Lukashov is the senior analyst of IFC Markets. He started his professional career in the financial market as a trader interested in stocks and obligations.


